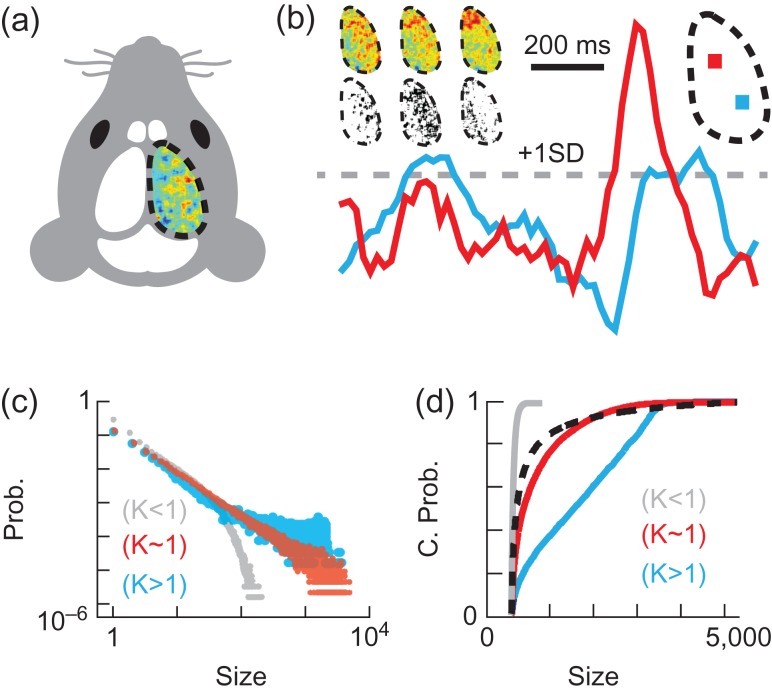
Figure 1.
Experimental setup and data analysis. (a) Voltage map for 20 ms over one cortical hemisphere in a head-fixed mouse with trans-cranial window. (b) Voltage traces from two pixels (each covering a 33 × 33 μm cortical area) in the regions with corresponding colors (top right). 20 ms of averaged activity from normalized data are shown at three time points, together with their corresponding point-process images (top left). (c) Example cascade size (pixels) probability distributions with few large cascades (κ < 1, grey, noise), near power law distribution (κ ≈ 1, red, awake), and abundant large cascades (κ > 1, blue, anesthetized). (d) Cumulative probability distributions for the same examples as in (c), together with a reference distribution with exponent −1.5 (black dotted line), the proximity to which is quantified by κ.

