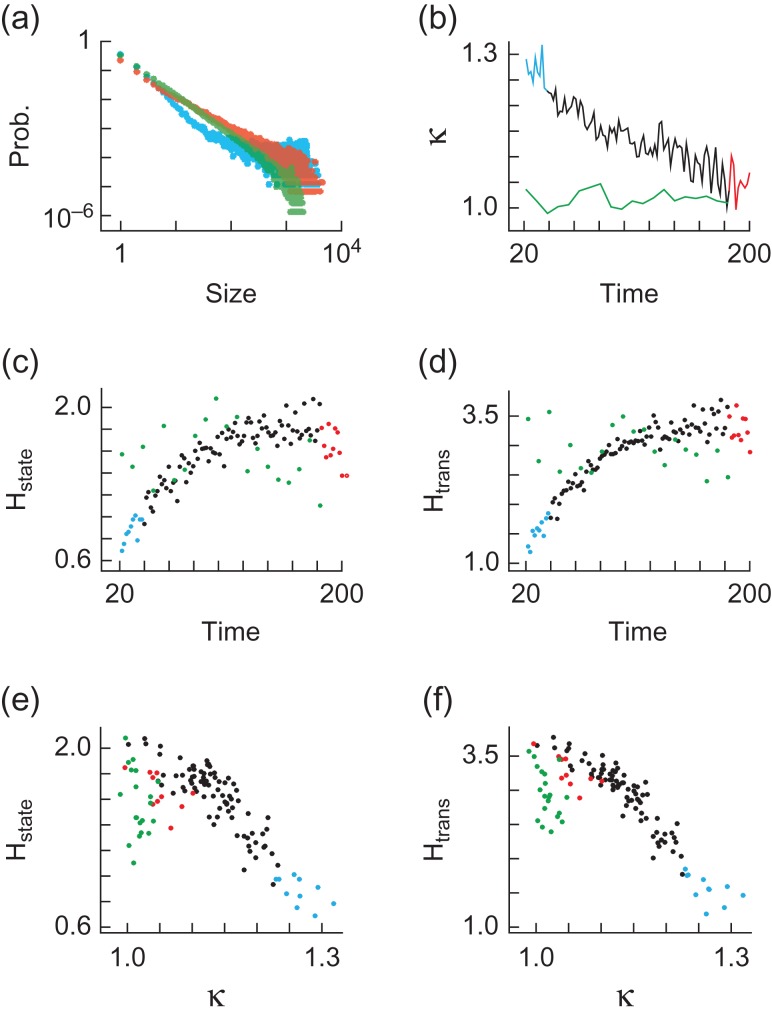
Figure 2.
Cortex-wide dynamics with recovery from anesthesia. (a) Cascade size (pixels) probability distributions are shown for anesthetized (blue) and awake (red) states from mouse A1 and fully awake results (green) from mouse R1. Blue and red colors correspond to the first and last 20 minutes of data, i.e. anesthetized and awake states. (b) κ values as a function of time (minutes) since drug delivery. Color coding and mice as in (a). (c) Time (minutes) since drug delivery vs. state visitation entropy Hstate (bits) derived from the probabilities of visiting each state for k-means clustering algorithm with 10 clusters. Color coding and mice as in (a). (d) Time (minutes) since drug delivery vs. state transition entropy Htrans (bits) derived from the probabilities of state transitions in a first-order Markov model for k-means clustering algorithm with 10 clusters. Color coding and mice as in (a). (e) State visitation entropy Hstate (bits) as a function of κ. Color coding and mice as in (a). (f) State transition entropy Htrans (bits) as a function of κ. Color coding and mice as in (a).

