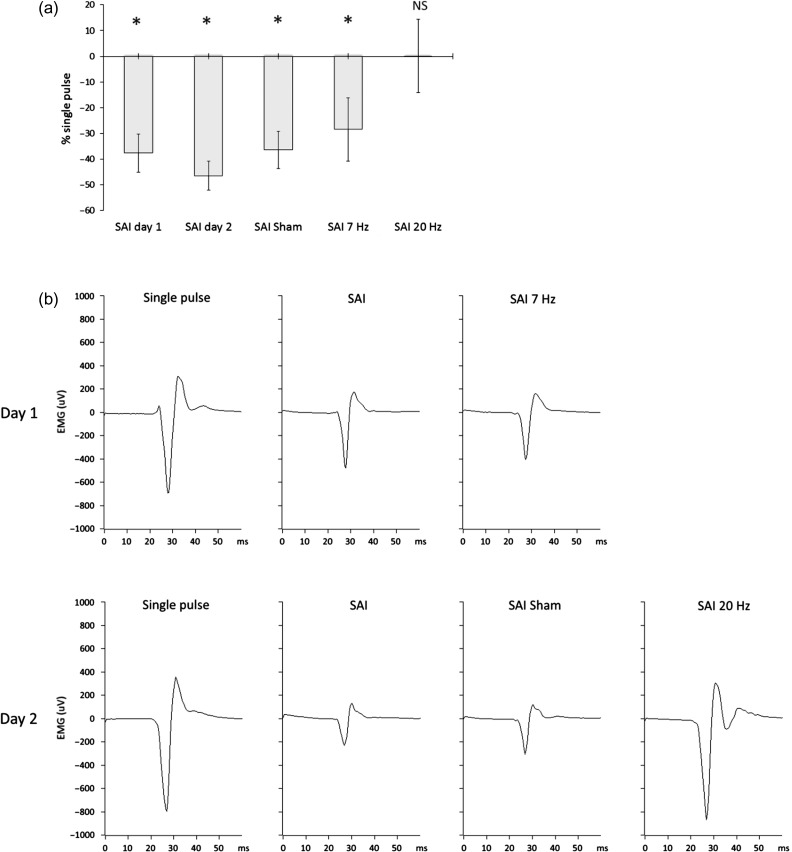
Figure 3.
SAI effectiveness across conditions. (a) Percentage increase or decrease of MEP size during the SAI tested conditions (SAI baseline during session 1, SAI baseline during session 2, SAI during sham tACS, SAI during 7 Hz tACS, SAI during 20 Hz tACS) versus the single suprathreshold stimulus (single pulse protocol). Asterisks denote significant inhibition ( P < 0.05). During the 20 Hz tACS condition, the effect of the SAI protocol was canceled. P values are presented after Bonferroni correction for multiple comparisons. Group mean and standard errors of the mean are shown ( n = 15 healthy subjects). (b) MEP amplitude modulation during SAI (data from a representative subject). The characteristic inhibitory effect of the SAI (with respect to the single pulse) was preserved in all conditions except during 20 Hz tACS, where the MEP size was about the same as during single pulse.

