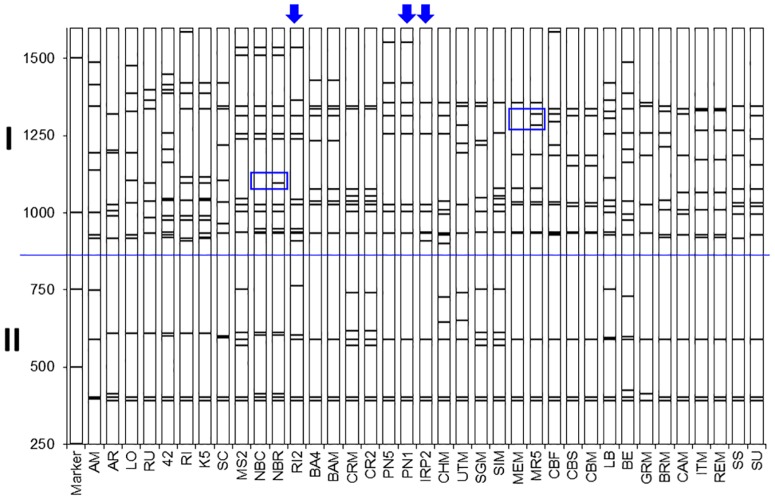
Fig 1. TBP genomic profiles.
TBP amplification pattern of the 37 grapevine accessions of Table 1. Cvs are ordered according to cluster analysis of Fig 2. Blue boxes indicate few polymorphisms associated to clones of the same cv. (NBC vs NBR and MEM vs MR5). Arrows on top indicate the profile of the IRP2 cross and its parentage (PN1 x RI2); I and II indicate TBP-amplified products containing introns longer or shorter than 500 bp; Molecular sizes marker is reported on the left.

