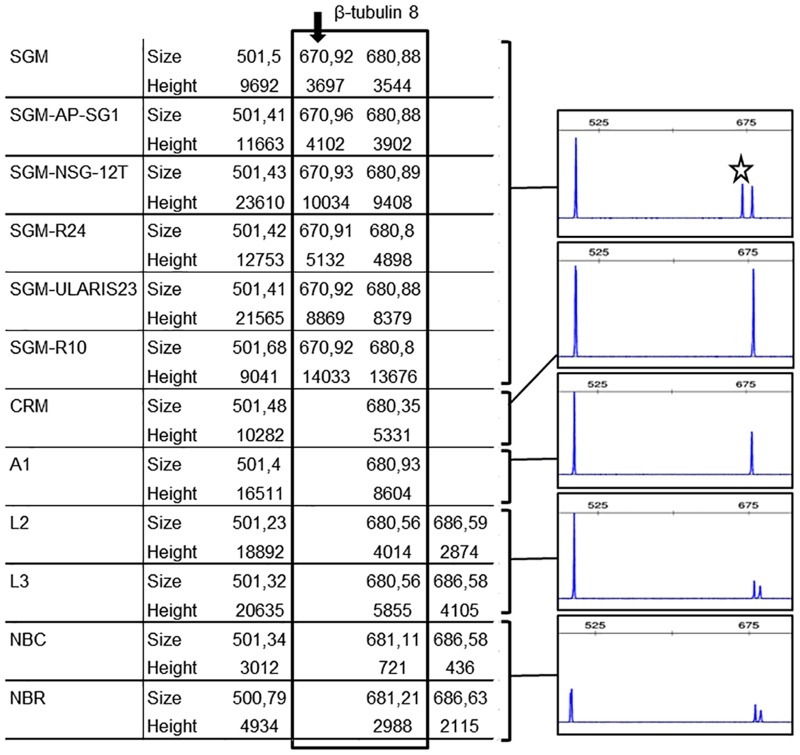
Fig 5. A doublet characterizes the ‘Sangiovese’ (SGM) cv.
On the left: CE-TBP values (peak size in base pair and peak height in Relative Florescence Unit—RFU) obtained from the amplification of the first β-tubulin intron, relative to entry 8 of the Vitis vinifera Genome Data Base (VvGDB, version Genoscope 12x). The box highlights the 670–680 bp specific doublet of the SGM cv., detected in all analysed clones. The SGM specific peak of about 670 bp is further highlighted by the arrow. On the right, the corresponding portion of the electropherogram are reported for each analysed cvs (‘Sangiovese’ (SGM); ‘Croatina’ (CRM); ‘Ancellotta’ (A1); ‘Lambrusco’ (L1, L3) and ‘Nebbiolo’ (NBC, NBR)). The star points to the specific 670 bp peak of ‘Sangiovese’ clones.

