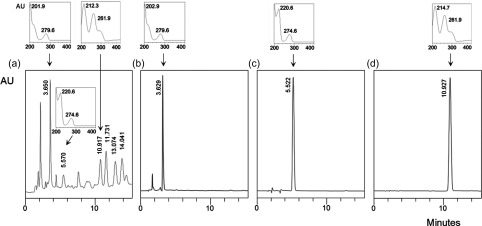
Figure 2.
Chromatography. HPLC chromatograms and peak spectra of (a) an olive ethanolic extract (OEE; from Olea europaea L. fruit pomace; 260 nm) and pure reference compounds which could be confirmed as constituents of the extract, (b) hydroxytyrosol (280 nm), (c) tyrosol (280 nm) and (d) trans-coniferyl alcohol (260 nm). Retention times (minutes; rotated view), the relative absorption intensity (AU) and UV spectra together with absorption maxima (wavelengths in nm) are indicated.

