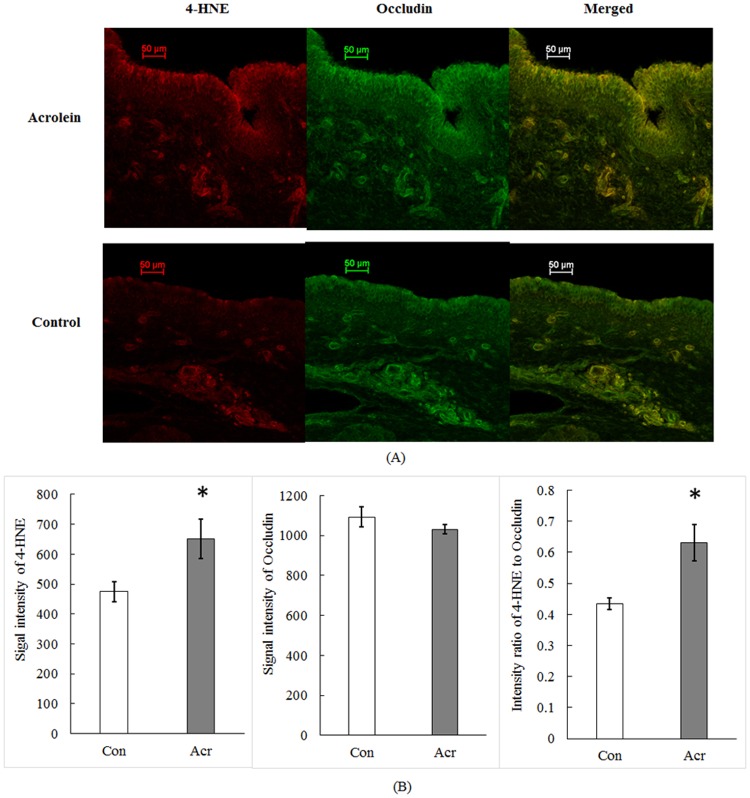
Fig 6. Immunohistochemical study of lipid peroxidation marker with or without acrolein exposure.
(A). A typical confocal image of vocal fold epithelia. 4-HNE was stained in red on the left panel; occludin was stained in green on the middle panel; and the merged signals in yellow was present on the right panel. (B). Quantification of signal intensities of 4-HNE and occludin. Data represent Mean ± SE, n = 4, *: p < 0.05 as compared to controls.

