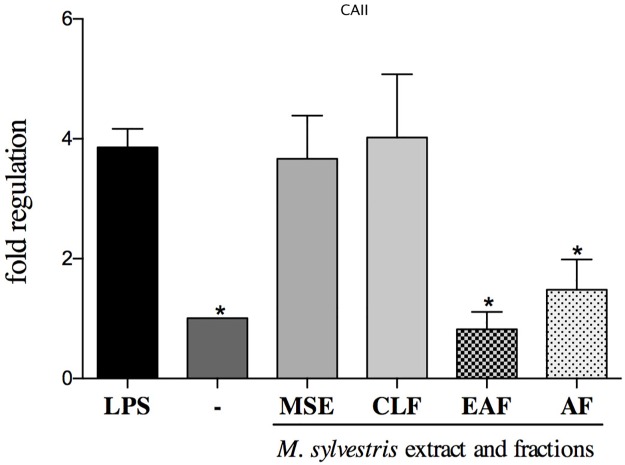
Fig 4. Effect of MSE and fractions on CAII (carbonic anhydrase II) expression levels.
Quantification of the relative transcript amounts performed by qpcR with 10 ng of each cDNA. Data quantification was performed using 2(-DeltaDeltaC(T)). Statistical analyses were performed by one-way ANOVA followed by Dunnett’s post-hoc tests. *p<0.05 significantly different from LPS-stimulated cells.

