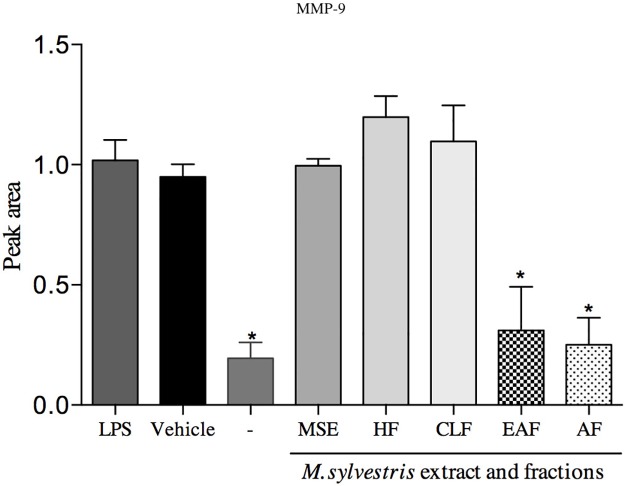
Fig 8. Effect of MSE and fractions on MMP-9 expression levels.
Proteolysis activity was stimulated by LPS (E. coli) 1 μg/mL. Supernatant was mixed 1:1 with sample buffer and then applied to the gels. Quantification was performed by peak area and normalized by the protein ladder band. Data quantification was performed using ImageJ software. Statistical analyses were performed by one-way ANOVA followed by Dunnett’s post-hoc test. *p<0.05 significantly different from LPS-stimulated cells.

