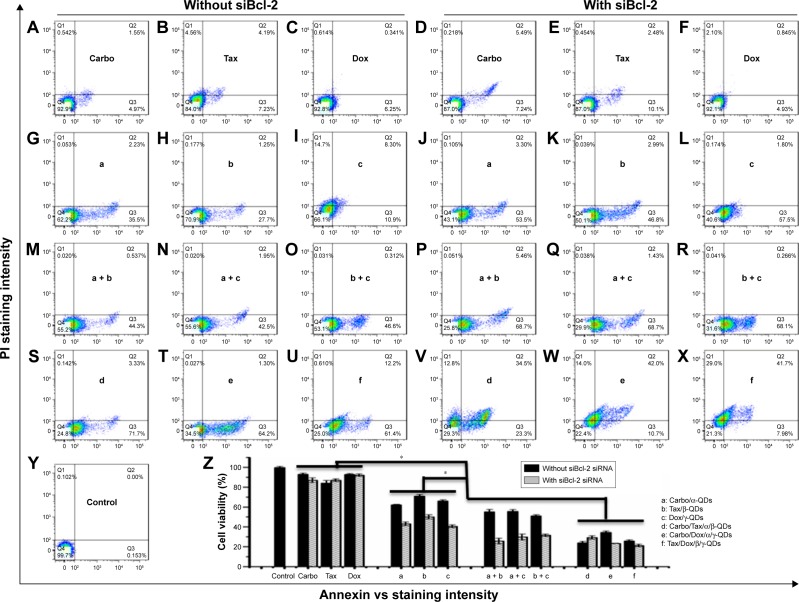
Figure 8.
Cell apoptosis of A549 cells detected by flow cytometric analysis.
Notes: Cells were treated with free drugs (A–C), free drugs/siRNA (D–F), drug-loaded QD nanocarriers (G–I), drug-loaded QD nanocarriers/siRNA (J–L), mixtures of two different drug/QD complexes (M–O), mixtures of two different drug/QD complexes with siBcl-2 (P–R), one type of QD nanocarrier loaded with two drugs (S–U), or one type of QD nanocarrier loaded with two drugs and siRNA (V–X). (Y) Untreated cells. Concentrations were: Carbo: 500 nM; Tax: 0.03 nM; Dox: 32 nM; siRNA: 50 nM. Incubation time: 72 hours. QD:siRNA =1:1. Part (Z) summarizes the data, showing that a combination of different chemotherapeutics with gene therapy caused nearly 80% cell lethality. Data are reported as mean ± SD (n=3). *P<0.05.
Abbreviations: Carbo, carboplatin; Dox, doxorubicin; QD, quantum dot; PI, propidium iodide; siRNA, small interfering RNA; Tax, paclitaxel.

