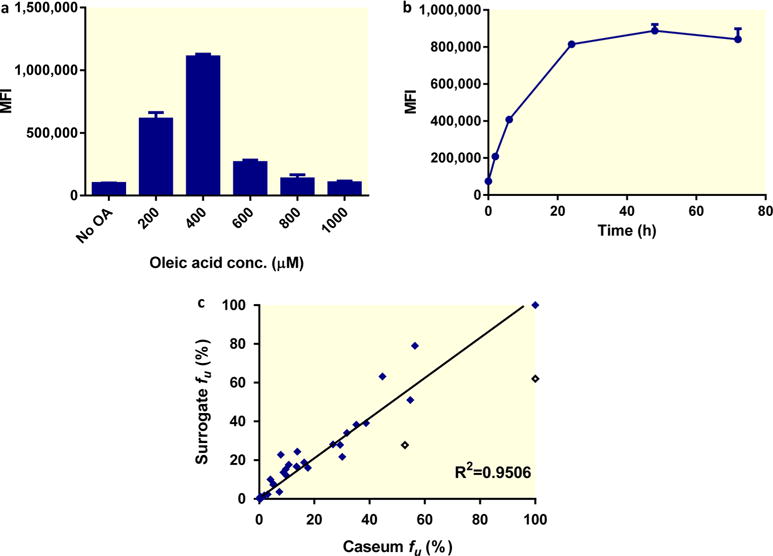
Figure 2.

In vitro generation and performance of caseum surrogate. (a) Dose–response of lipid droplet accumulation in THPMs. Macrophages were exposed to increasing concentrations of oleic acid for 24 h, and lipid droplet accumulation was quantified by staining with BODIPY 493/503 and detection by flow cytometry. (b) Time-course of lipid droplet accumulation in THPMs exposed to 400 μM of oleic acid. Lipid droplet content was quantified using BODIPY and is presented as the mean fluorescence intensity (MFI). The average and standard deviations (error bars) of three independent experiments are shown. (c) Correlation between the fraction unbound (fu) of selected drugs in caseum and the surrogate matrix. The best-fit line excluding the outliers (hollow diamonds) was determined using linear regression. The goodness of fit is expressed as the R2 value.
