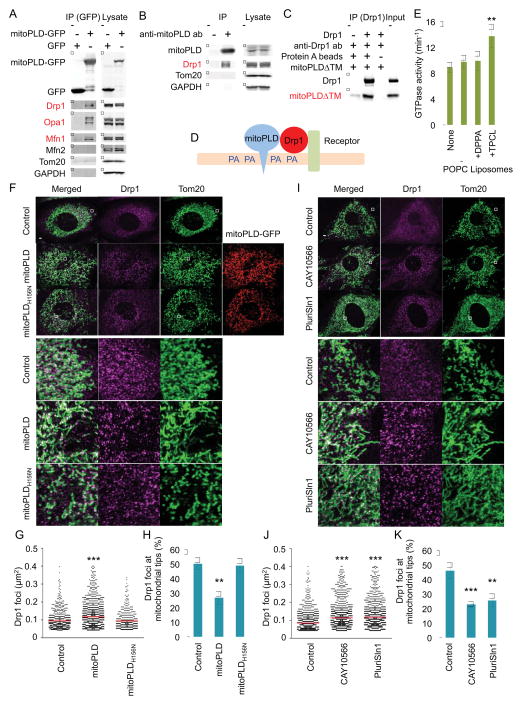
Figure 4. Mechanism of phospholipid-mediated suppression of mitochondrial division.
(A) Cells expressing MitoPLD-GFP or GFP were subjected to immunoprecipitation using anti-GFP antibodies. Drp1, Mfn1 and Opa1 specifically bind mitoPLD-GFP. (B) Mouse testes were subjected to immunoprecipitation using anti-MitoPLD antibodies. Drp1 specifically bind MitoPLD. (C) A FLAG-tagged cytoplasmic domain of MitoPLD (mitoPLDΔTM) was incubated with His6-Drp1, and His6-Drp1 was pulled down with anti-Drp1 antibodies. Drp1 directly binds mitoPLDΔTM. (D) Model for inhibitory lipid microenvironment created by the Drp1-MitoPLD interaction. (E) The GTPase activity of His6-Drp1 was measured in the presence of the indicated liposomes. Saturated PA containing liposomes does not stimulate the GTPase activity of Drp1. Mean ± SEM (n = 5). (F–K), WT MEFs expressing MitoPLD-GFP or MitoPLDH156N-GFP (F, G and H) or treated with SCD1 inhibitors (I, J and K) were subjected to immunofluorescence microscopy with antibodies specific for Tom20 and Drp1. The sizes of the Drp1 foci in the mitochondria were quantified (G and J). Red lines correspond to means (more than 300 Drp1 foci were analyzed). The relative abundance of Drp1 foci associated with the tips of mitochondrial tubules was determined (H and K). Mean ± SEM (n = 10 cells). Student’s t-test: **p< 0.01, ***p< 0.01. Bar, 10 μm.

