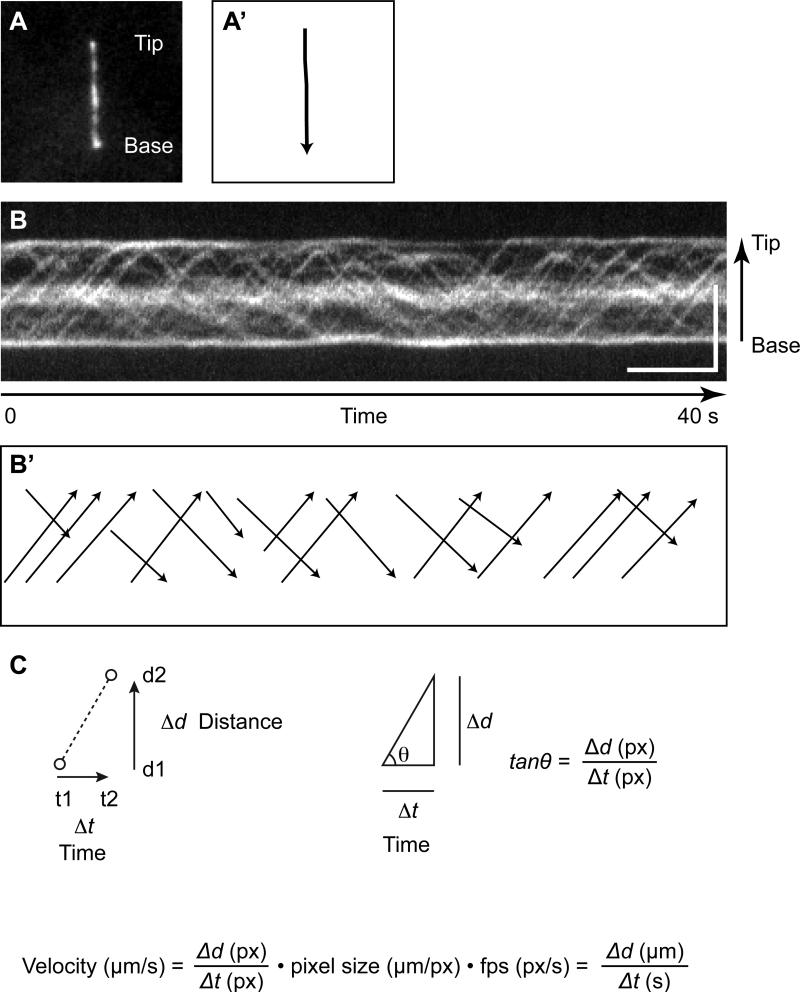
Figure 3. Kymograph analysis for measuring IFT velocity.
(A) An image of IFT-88EGFP in the primary cilium of mIMCD-3 cells from Movie 1. (B) Kymographs of IFT-88EGFP moving in the cilium of mIMCD-3 cells. The kymographs was assembled from Movie 1. Bars: 5 s (horizontal), 5 μm (vertical). (A’ and B’) Draw lines along with the cilium or trajectories of IFT trains for making a kymograph and measuring the angle of the trajectory, respectively. (C) The IFT velocity is given from the angle of trajectory of IFT train.

