. 2016 Sep 20;5:e13479. doi: 10.7554/eLife.13479

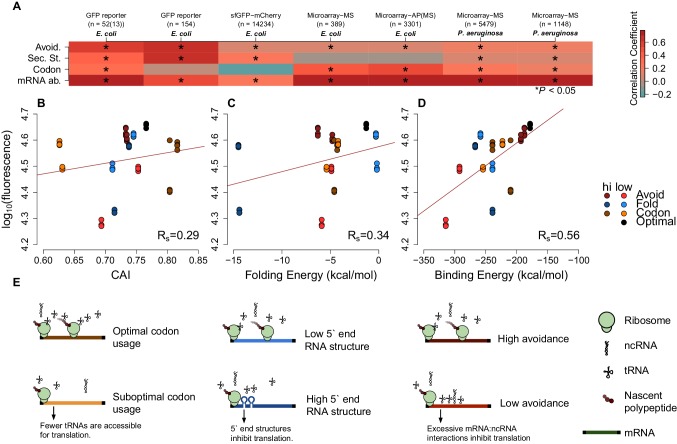
Figure 2. mRNA attributes have different impacts on protein abundance.

(A) This heatmap summarizes the effect sizes of four mRNA attributes (avoidance of mRNA:ncRNA interaction, 5´ end secondary structure, codon bias and mRNA abundance) on protein expression as Spearman’s correlation coefficients, which are represented in gradient colors, while a starred block shows if the associated correlation is significant (p<0.05). (B) GFP expression correlates with optimized codon selection, measured by CAI (Rs = 0.29, p=0.016). (C) GFP expression correlates with 5 end secondary structure of mRNAs, measured by 5’ end intramolecular folding energy (Rs = 0.34, p=0.006). (D) GFP expression correlates with avoidance, measured by mRNA:ncRNA binding energy (Rs = 0.56, p=6.9 × 10−6). (E) Each cartoon illustrates the corresponding hypothesis; (1) optimal codon distribution (corresponding tRNAs are available for translation), (2) low 5´ end RNA structure (high folding energy of 5´ end) and (3) avoidance (fewer crosstalk interactions) lead to faster translation.

DOI: http://dx.doi.org/10.7554/eLife.13479.006

Figure 2.

Figure 2—figure supplement 1. GFP mRNA constructs have an unbiased design that produces different protein expressions.

Figure 2—figure supplement 1.

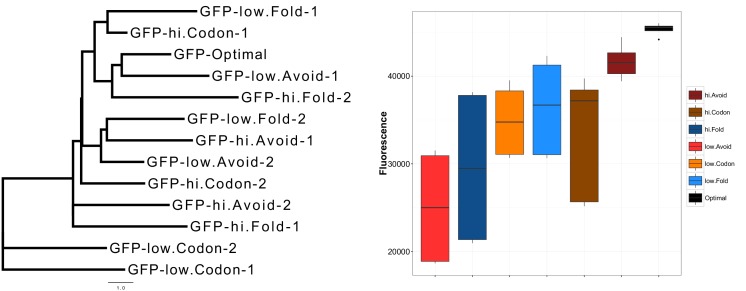
An unrooted maximum likelihood tree of the extreme GFP mRNAs on the left panel illustrates the low similarity between our GFP mRNA constructs. The distances were calculated using HKY85 nucleotide substitution model. On the right panel, the y-axis shows relative fluorescence units (RFU) of GFP expression from synonymously sampled mRNAs with different characteristics, these are labelled on the figure legend. Optimal and high avoidance GFP mRNAs produce the highest expression while low avoidance GFP mRNAs have the lowest expression (p=1.35 × 10−5, Kruskal-Wallis test).

Figure 2—figure supplement 2. The scatter-plots of protein abundances (as log-fluorescences) summarize the effect of general factors for extreme GFP and previously published GFP datasets.

Figure 2—figure supplement 2.

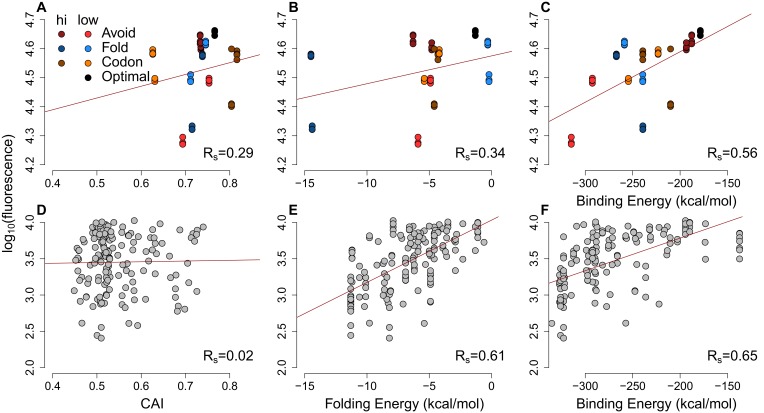
(A–C) Each GFP mRNA was sampled from the extremes of one of three metrics presumed to impact expression mRNA:ncRNA binding, 5´ end secondary structure or codon usage. Slightly darker or lighter colors display the type of extremes. Avoidance correlates with GFP expression (Rs = 0.56, p=6.9 × 10−6) more than CAI (Rs = 0.29, p=0.01) and 5´ end folding energy (Rs = 0.34, p=0.006). (D–F) Using a previously published GFP dataset (Kudla et al., 2009) the CAI does not correlate with protein abundance (Rs = 0.02, p=0.4), while 5´ end folding energy (Rs = 0.61, p=5.7 × 10−18) and avoidance (Rs = 0.65, p=1.6 × 10−20) influence GFP expression.

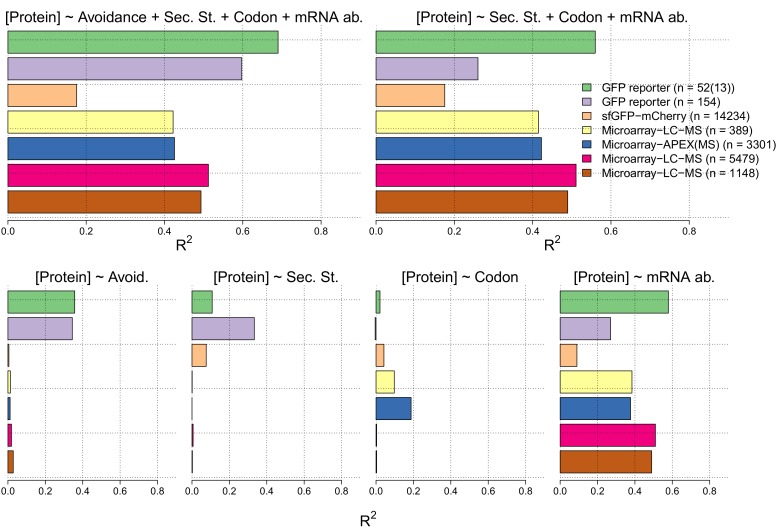
Figure 2—figure supplement 3. In the lower four panels we show the R2 values for linear regression models between measures of each of avoidance, internal secondary structure, codon usage and mRNA levels for each of seven independent protein and mRNA expression datasets Supplementary file 5).

Figure 2—figure supplement 3.

We have also computed R2 values for multiple linear regression models of the sum of the four measures (right) and the sum less the avoidance measure (right).

Figure 2—figure supplement 4. An outlier analysis of E. coli protein-per-mRNA ratios and avoidance, codon usage and internal mRNA secondary structure statistics.

Figure 2—figure supplement 4.

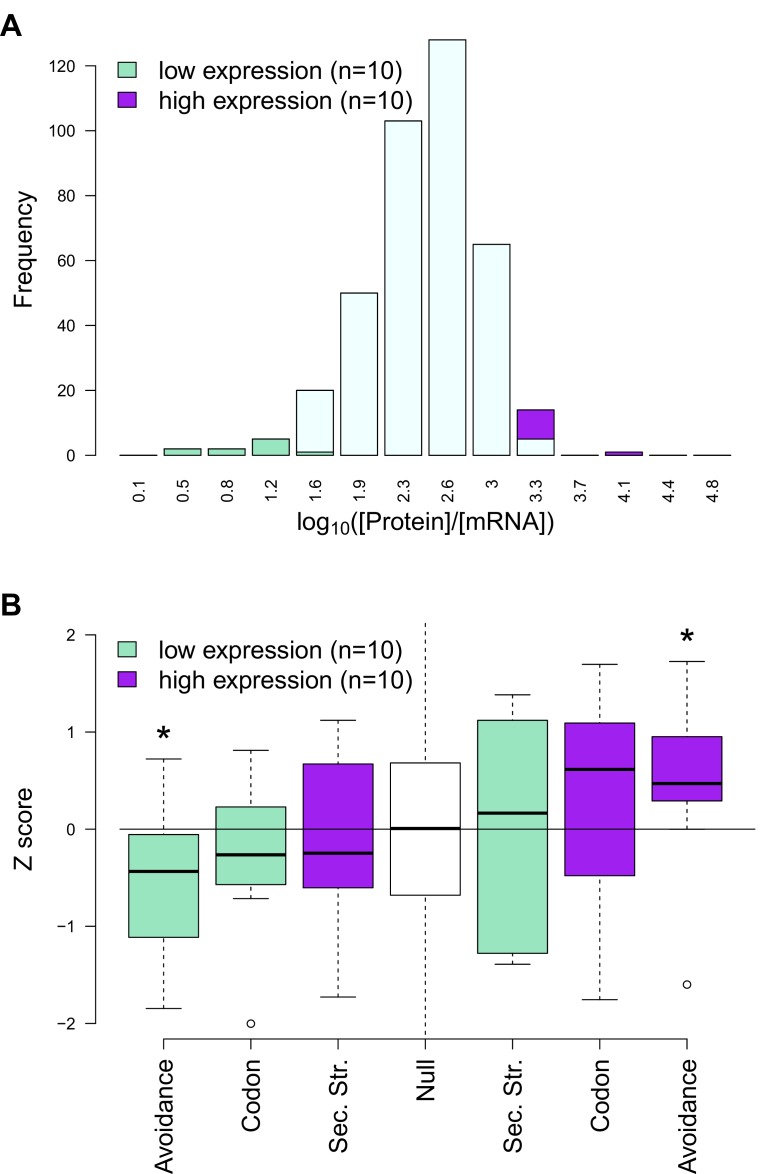
(A) In this plot a distribution of protein-per-mRNA ratio of native E. coli genes (n = 389) (Laurent et al., 2010) is seen. We selected the top ten most and least productive genes which lie on the extreme ends of the plot (purple and green bars) (B) The y-axis shows the z-transformed scores of native mRNAs: CAIs, folding energies and binding energies. The expected background distribution (the white null bar in the middle) has a mean of 0 and standard deviation of 1, while a starred block shows whether the associated z-scores are significantly higher (or lower) than this background (p<0.05). This demonstrates RNA avoidance is the only factor that explains protein-per-mRNA ratio difference of the most and the least efficient native E. coli mRNAs.

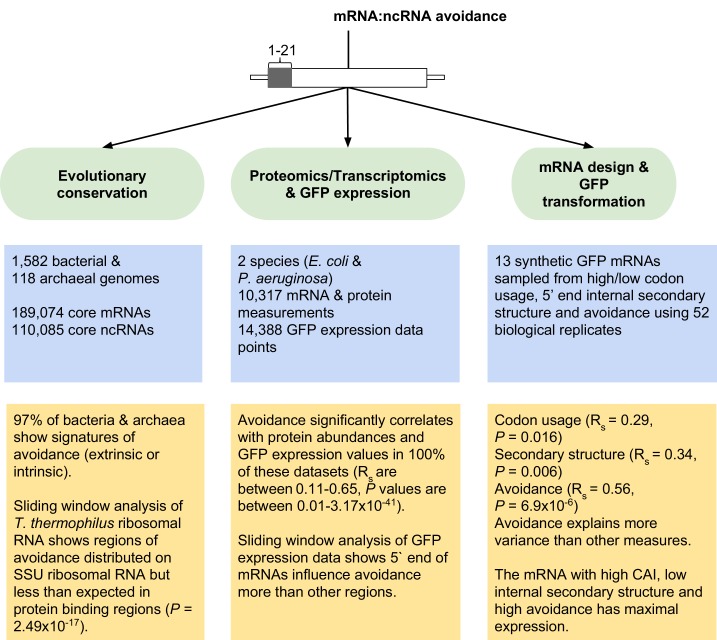
Figure 2—figure supplement 5. Overview of mRNA:ncRNA avoidance analysis and results.

Figure 2—figure supplement 5.

Our tests for avoidance can be divided into three main parts; (1) evolutionary conservation analyses to detect energy shifts in bacterial and archaeal genomes relative to dinucleotide shuffled negative controls, (2) analyses of proteomics, transcriptomics and GFP transformation data to predict the effect size of avoidance on protein expression and lastly (3) the application of avoidance hypothesis to design synonymous mRNAs that either produce high or low levels of corresponding protein.