
Figure 2. Knocking down R825/825* enhances resistance to Pst DC3000.
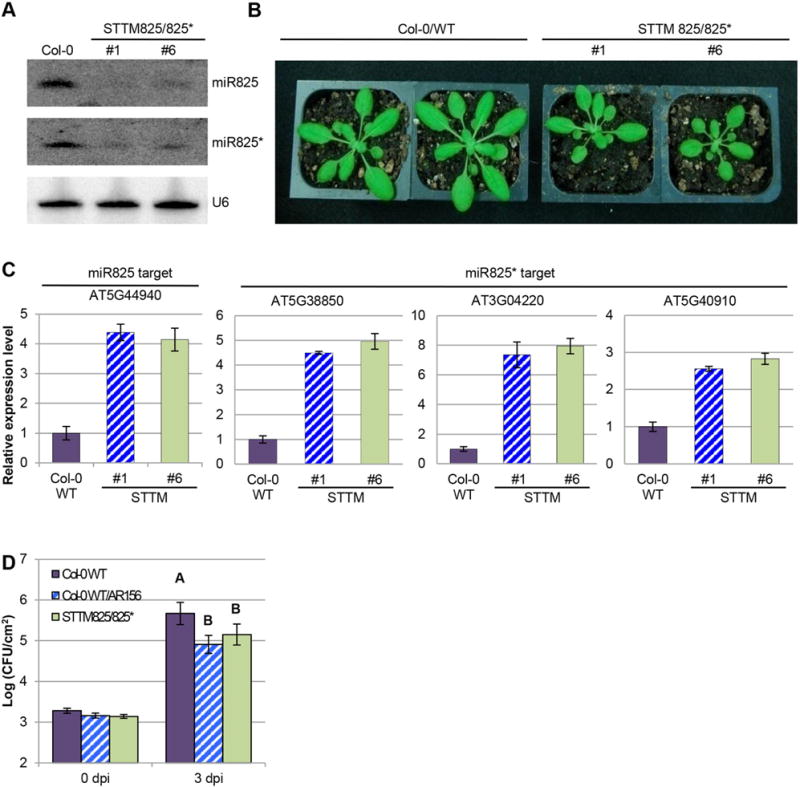
(A) Expression of miR825 and miR825* in STTM transgenic plants is examined by Northern blotting assay. RNA blots are hybridized with DNA oligonucleotide probes complementary to the indicated miRNAs. U6 is used as a loading control. (B) Phenotype of STTM825/825* transgenic plants (line 1 and 6) are compared to Col-0 WT plants. Pictures are taken 4 weeks after germination. (C) miR825 and miR825* target genes in the indicated transgenic lines is examined by qRT-PCR assay. Target genes and line numbers (#1 and #6) are as indicated. (D) AR156-mediated ISR in Col-0 and transgenic lines. Plants pre-treated with AR156 at 5 × 10⁷ CFU/mL and 0.85% NaCl for 7 days, respectively. Leaves are spray inoculated with Pst DC3000 cell suspension at 1 × 10⁸ CFU/mL concentration. ISR is measured by counting colonies on plates 3 days after inoculation (dpi). Error bars represent standard deviation for at least 12 leaf discs. Statistical difference among samples is represented by using letters: different letters (A and B) represent significant difference (P < 0.01) while same letters represent insignificant differences (P > 0.01).