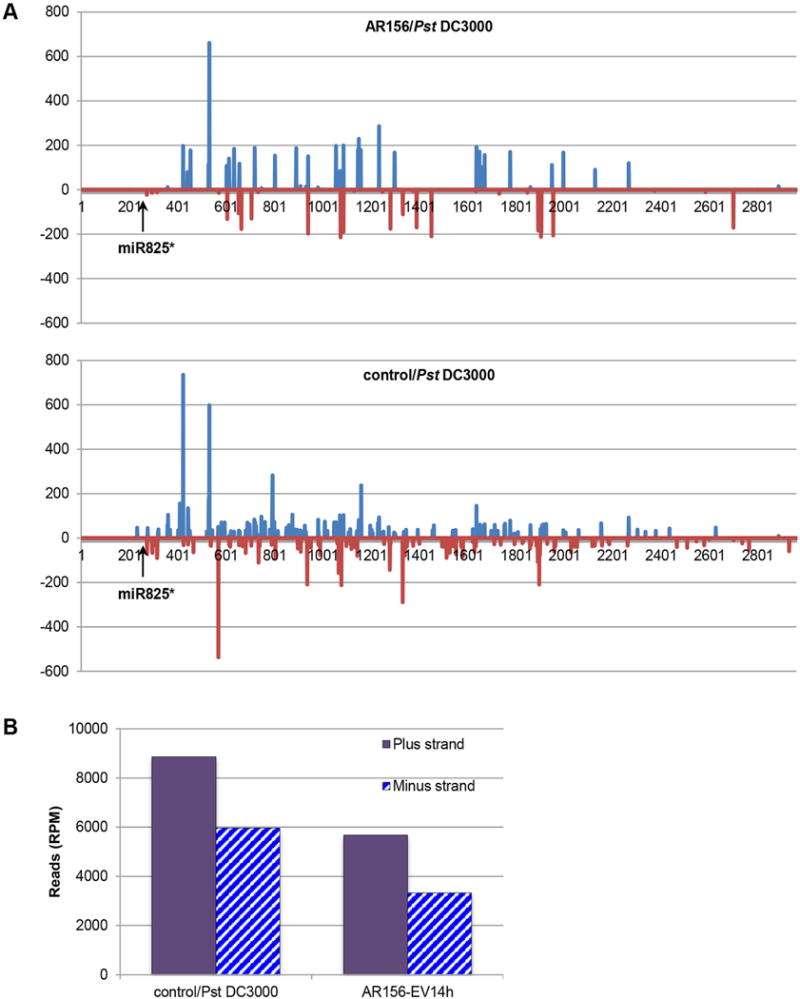
Figure 6. Identify 2nd siRNAs at the At5g38850 locus.

(A) siRNAs are aligned to the Arabidopsis genome (version TAIR 10) by sequence similarities. Reads (read per million; RPM) is shown as bars at the Y-axis whereas locations of the siRNAs are presented at the X-axis. Light blue represents alignment to the plus strand while red to the minus strand. miR825* cleavage site is marked by an arrow, which is the 251 nt to the 5′ end. Up: AR156/Pst; bottom: control/Pst. (B) The total reads aligned to the plus or the minus strand in each sample is calculated by adding all the reads up and plotted to the right side of the corresponding figure.
