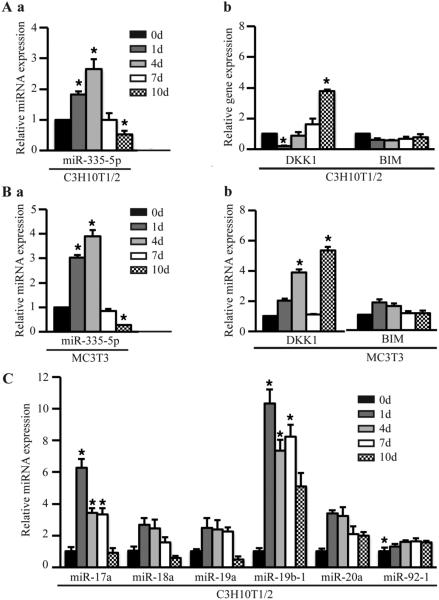
Figure 1.
Gene and miRNA expressions during osteogenesis. (A) miR-335-5p (a), Dkk1 and BIM (b) expression in C3H10T1/2 cells. (B) miR-335-5p (a), Dkk1 and BIM (b) expression in MC3T3-E1 cells. (C) miR-17~92 cluster expression in C3H10T1/2 cells. Cells were induced in osteogenic medium with 50 mg/mL of ascorbic acid for 1, 4, 7 and 10 days, respectively. mRNA and miRNA expression were detected by quantitative RT-PCR. These data are expressed as the mean ± SD (n=3). * p < 0.05, versus day 0 before induction.

