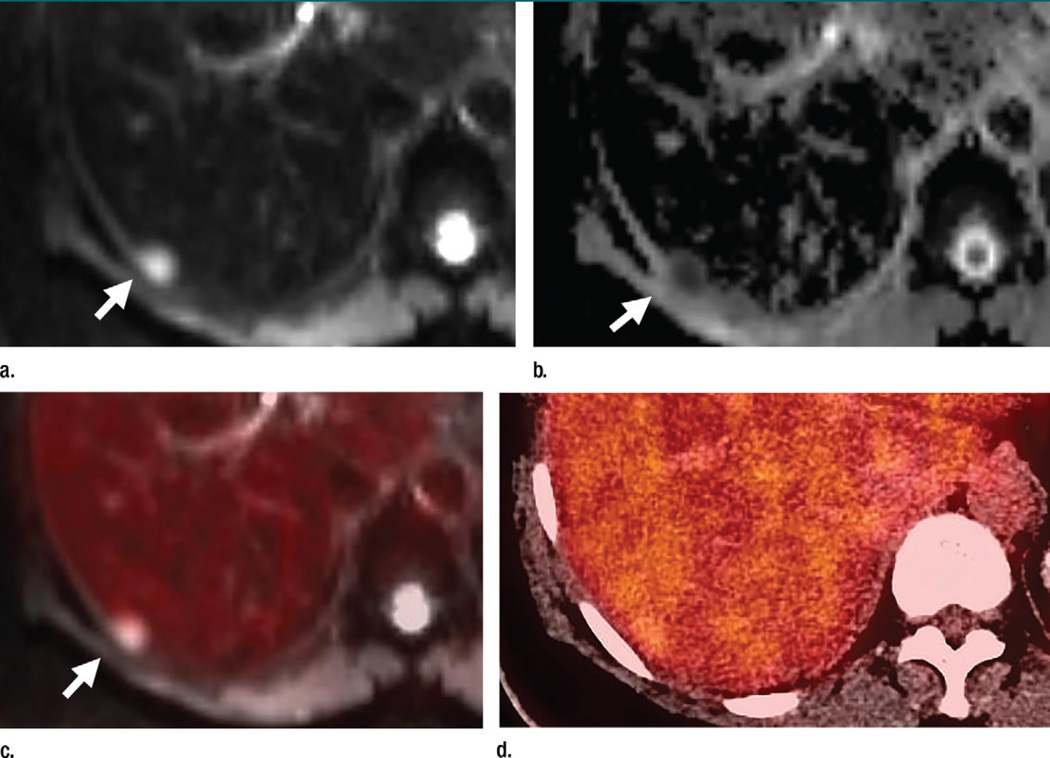
Figure 1.
Axial (a–c) PET/MR and (d) PET/CT images in a 64-year-old woman with a history of left breast cancer metastatic to lung and bone obtained to monitor response during chemotherapy. A liver metastasis (arrow) is seen on the PET/MR images (a–c) but not on the PET/CT image (d). The metastasis is best seen as an area of high signal intensity on the diffusion-weighted image (a), with corresponding low signal intensity on the apparent diffusion coefficient map (b). There is minimal corresponding FDG uptake on the fused diffusion-weighted and PET image (c). This metastasis was also seen on contrast-enhanced T1-weighted images (not shown). This metastasis is not seen on PET/CT images (d).

