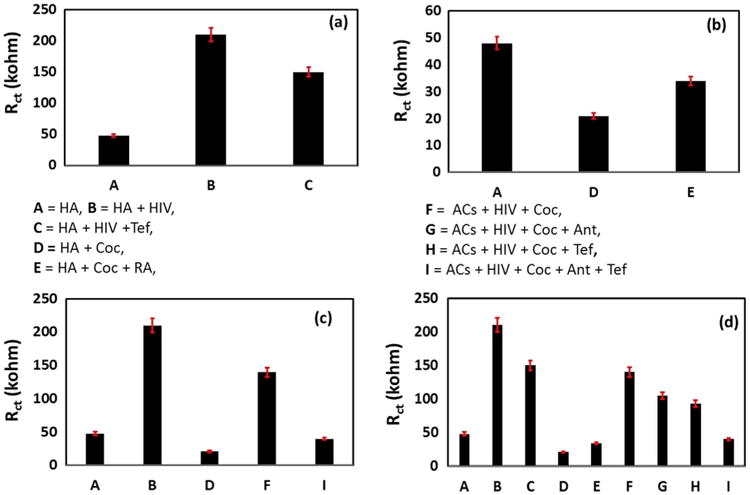
Fig. 3.

EIS measurement of CC treated with HA, HIV, Coc, Tef, RA and all together. 1st –well HA=A, 2nd –well HA & HIV = B, 3rd –well HA & HIV + Tef = C, 4th –well HA & Coc =D, 5th –well HA & Coc + RA = E, 6th –well HA & HIV & Coc = F, 7th –well HA & HIV & Coc + RA = G, 8th -well HA & HIV & Coc + Tef. = H, 9th –well HA & HIV & Coc + Tef +RA =I. (a) HA, HA & HIV-infection, HA & HIV-infection + Tef. (b) HA & Coc, HA & Coc + RA, (c) HA, HA & HIV-infection, HA & Coc, HA & HIV & Coc, HA & HIV-infection & Coc + RA + Tef. (d) Rct variation as function of all treatment. The EIS measurements were performed in 400 μL of 5 mM PBS (pH 7.4) containing 5 mM Fe (II)/Fe(III), as redox moieties.
