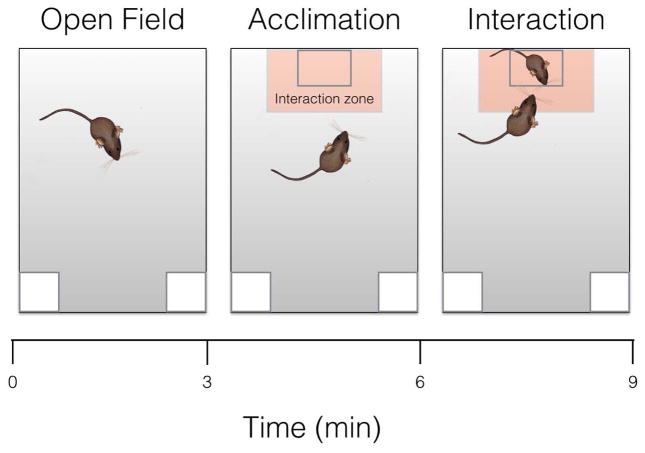
Fig. 2. Diagram of social Interaction test.
(3 consecutive stages). Each phase of the social interaction tests, a) open field, b) acclimation, and c) interaction, lasted 3 minutes. Mouse in the small box represents novel conspecific target mouse. In light orange is represented the area considered as the interaction zone.

