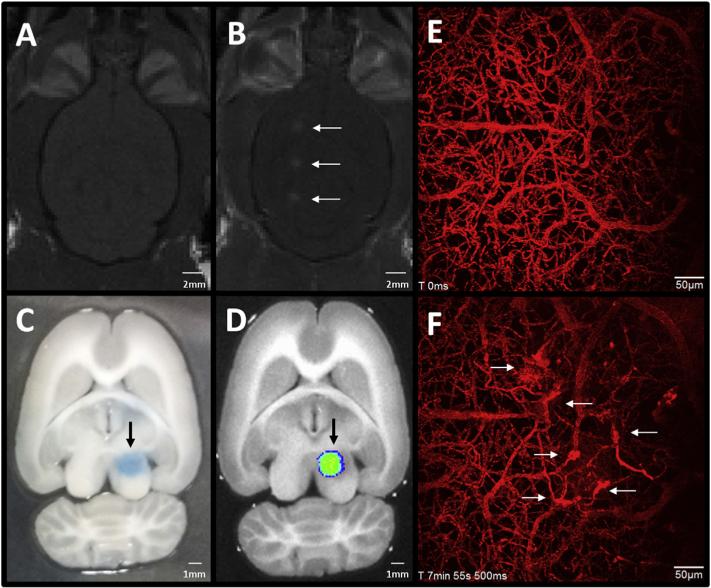
Fig. 3.
Methods to visualize FUS-mediated BBBO. (A, B) T1-weighted MR images in the horizontal plane show gadolinium contrast enhancement in a rat brain (A) before and (B) 10 min after FUS-mediated BBBO. White arrows indicate the three areas of BBBO. (C, D) Evans blue dye is a commonly used indicator of BBBO. (C) A vibratome-sectioned (500 μm thick), perfused rat brain slice shows the region of Evans blue dye extravasation 2 h following FUS. (D) The same section, imaged with a Xenogen IVIS-200™ system, demonstrates the fluorescent signal emitted by Evans blue, providing a quantitative measure of BBBO. Black arrows indicate the area of BBBO. (E, F) On a microscopic scale, two-photon imaging through a cranial window provides a means of evaluating BBBO with higher temporal and spatial resolution, compared with the methods mentioned above. Here, maximum projection images of 400 μm Z-stacks are shown. (E) Prior to sonication, dextran-conjugated Texas-Red dye is intravenously injected, allowing the visualization of blood vessels, and (F) the time course of BBBO. Regions of dye leakage in the field of view can be observed following FUS (white arrows). Time stamps indicate the time from the start of imaging. Abbreviations: FUS = focused ultrasound, BBBO = blood-brain barrier opening, MR = magnetic resonance. (For interpretation of the references to colour in this figure legend, the reader is referred to the web version of this article.)

