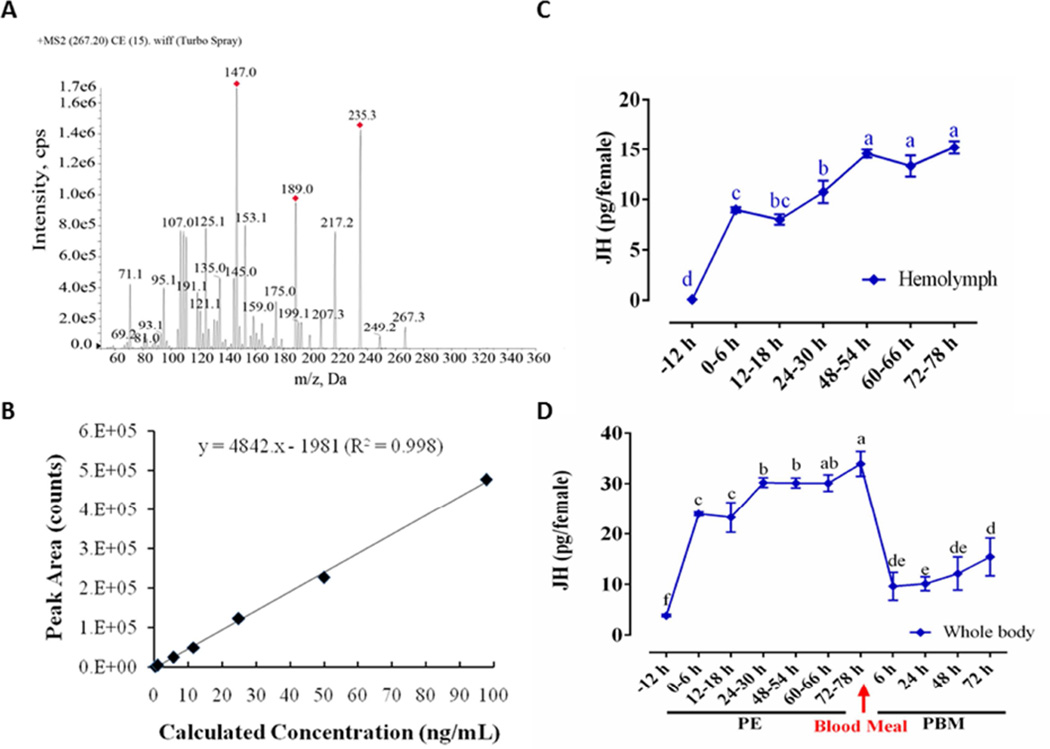
Figure 1.
(A) The JH III mass spectra. Molecular weight of JH III is 266.2, the precursor ion plus a proton [M + H; m/z = 267.3]. (B) The standard curve of JH III includes 8 different concentration gradients, and the lowest detectable value is 0.1 ng/ml. (C) JH III titer in the hemolymph during PE stage. (D) JH III titer in whole-body homogenates during the Ae. aegypti reproduction cycle. JH III was measured in pg/female, and the letters a-f in X axis represents statistical differences at multiple time points. If the two groups have the same letters, their data are significantly different (P < 0.05). Error bars represent ± SD.

