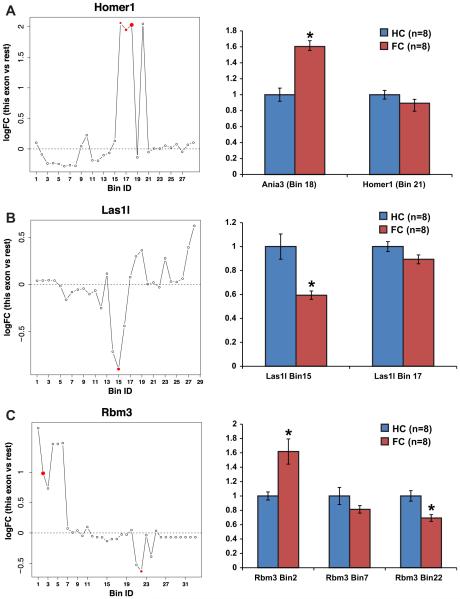
Fig. 1.
Bin-specific regulation of Homer1 (Ania-3), Las1l, and Rbm3. (A) (left) diffSplice result showing the predicted significant bin changes of the Homer1 gene in red on a log2 scale. Bins 16–18 indicate the Ania-3 isoform. (right) qPCR validation of the change in Bin18 in an independent cohort of mice. Bin 21 expression was compared as a control. (B) (left) diffSplice result showing the predicted significant bin changes of the Las1l gene in red on a log2 scale. (right) qPCR validation of the change in Bin 15 in an independent cohort of mice. Expression of Bin 17 was used as a control. (C) (left) diffSplice result showing the predicted significant bin changes of the Rbm3 gene in red on a log2 scale. (right) qPCR validation of the changes in Bin 2 and Bin 22 an independent cohort of mice. Expression of Bin 7 was used as a control. HC = homecage, FC = fear conditioned. * denotes a p-value of <0.05. (For interpretation of the references to colour in this figure legend, the reader is referred to the web version of this article.)

