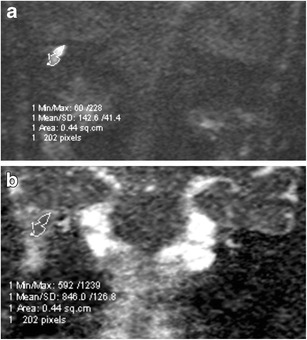
Fig. 4.

Measuring the ADC value of a lesion. a As the lesion was better seen on the b1000 image, a freehand region of interest (ROI) was contoured around the inner border of the lesion. An image was selected so the central part of the lesion was measured to avoid partial volume averaging. The software then maps the ROI on b the corresponding ADC map where the ADC value is automatically calculated ADC value 846 x 10-6 mm2/s. For accuracy, this can be repeated several times and a median reading obtained. In some cases, if the lesion is well seen on the ADC map, the ROI can be placed directly on the map for ADC value calculation
