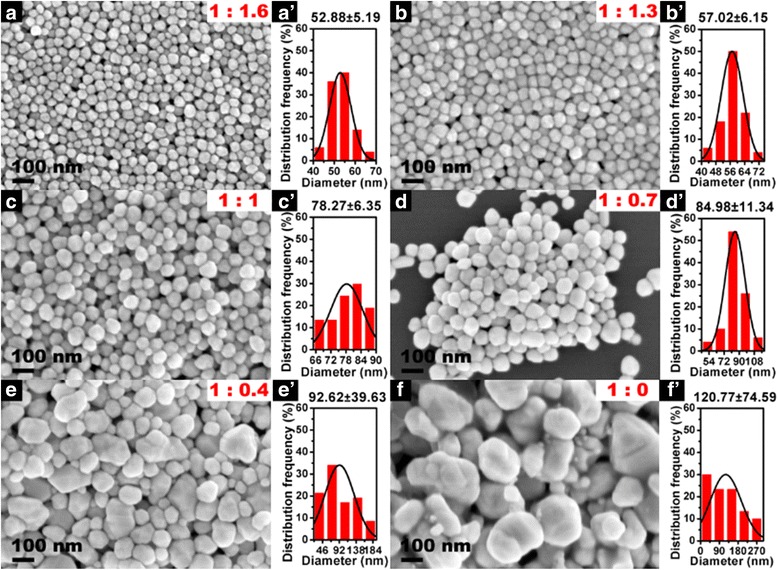
Fig. 2.

Representative SEM images of the as-synthesized Ag NPs with different mass ratio of AgNO3 and PVP. a Sample S1. 1:1.6. b S2, 1:1.3. c S3, 1:1. d S4, 1:0.7. e S5, 1:0.4. f S6, 1:0. aˊ–fˊ The corresponding histogram of particle size distribution (The result was statistically analyzed by JEOL Smile View software with more than 100 resoluble particles)
