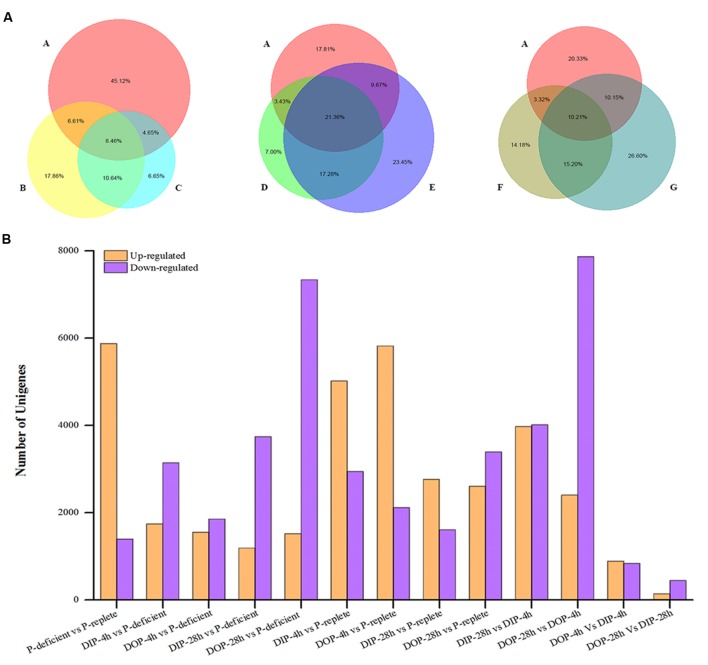
FIGURE 3.
Statistical analysis of differential expression genes in S. costatum under different P conditions. (A) Distribution of differentially expressed genes shared among different P conditions. The size of the circle represents the number of differential expression genes. A represents P-replete vs. P-deficient, B represents DIP (dissolved inorganic phosphorus)-supplied-4 h vs. P-deficient, C represents DOP (dissolved organic phosphorus)-supplied-4 h vs. P-deficient, D represents DIP-supplied-28 h vs. P-deficient, E represents DOP-supplied-28 h vs. P-deficient, F represents DIP-supplied-28 h vs. DIP-supplied-4 h, and G represents DOP-supplied-28 h vs. DOP-supplied-4 h. “A vs. B” is A normalized to B. (B) Statistical analysis of differential expression gene number in each comparison between two samples. Orange represents the up-regulated genes in the former compared with the latter, and purple represents the down-regulated genes.

