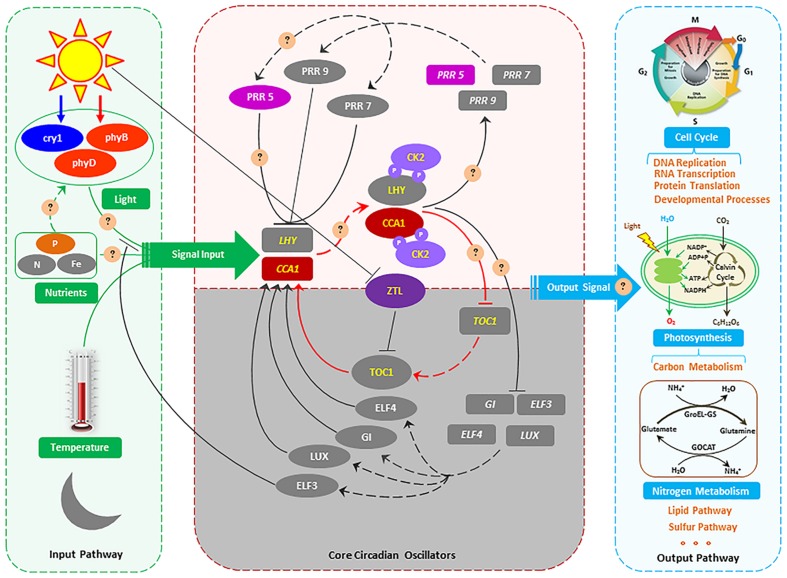
FIGURE 4.
The proposed molecular model of circadian rhythms in S. costatum. Genes are indicated using oblong shapes with the italic gene names in the shape. Proteins are indicated using oval shapes with the protein name in the shape. Transcription and translation is indicated by dashed lines. Positive action is indicated by solid lines with lines ending in arrowheads, and negative action is indicated with lines ending in perpendicular dashes. The core CCA1 (circadian clock associated 1)/LHY/TOC1 circadian oscillator is highlighted in red lines. Phosphorylation of LHY and CCA1 by CK2 (casein kinase II) is indicated with circled P’s in purple. The shaded area indicates activities peaking in the nighttime, and the white area activities peaking in the daytime. The gray oblong and oval shapes represent the genes or proteins that are identified in Arabidopsis thaliana (McClung, 2006; Bujdoso and Davis, 2013), but not identified in the S. costatum transcriptome in our study. Because the sampling was conducted in the daytime, so the genes which are active in the nighttime were not detected in this study. In part of the input pathway, light, temperature and nutrient (N, Fe, etc.) have been identified as the main input signal, but P as the input signal has not been reported. For the output pathway, the metabolic pathways affected by circadian rhythms that are demonstrated in the green alga Chlamydomonas reinhardtii, the flagellate Euglena gracilis, the cyanobacterium Synechococcus elongata, and the dinoflagellate Gonyaulax polyedra (Hunt and Sassone-Corsi, 2007) and Arabidopsis thaliana (Bujdoso and Davis, 2013) might also be affected in S. costatum. The circles and questions marks indicate possible regulatory mechanisms of circadian rhythm in S. costatum responses to ambient P changing.

