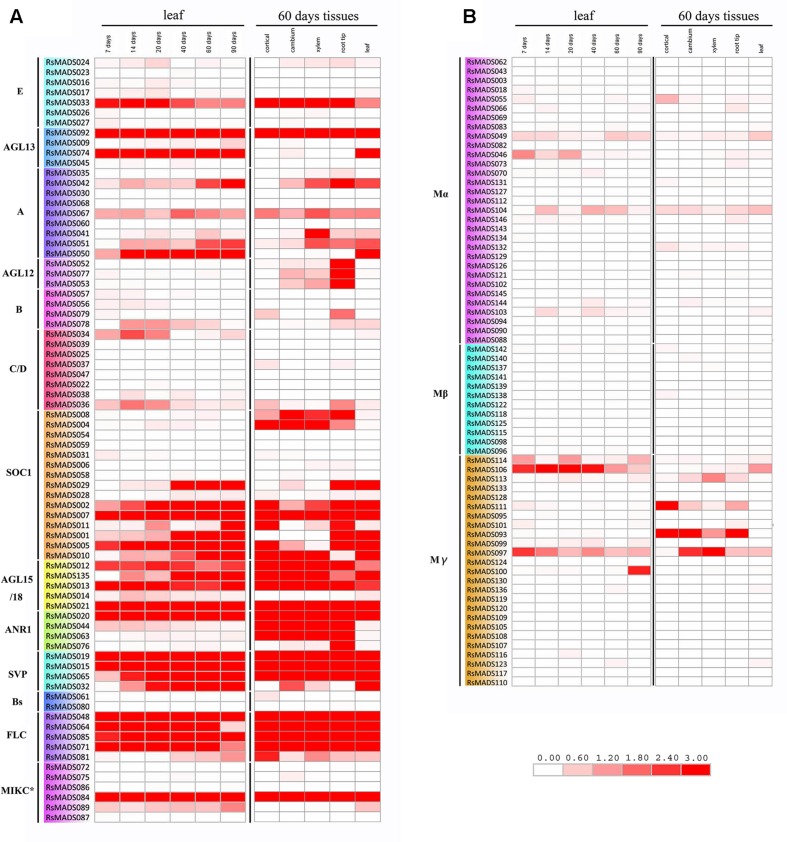
FIGURE 5.
Expression heat map of RsMADS genes in different stages and tissues. (A,B) Represent Type II and Type I RsMADS expression profiles in six stages (7, 14, 20, 40, 60 and 90 DAS) and five tissues (cortical, cambium, xylem, root tip and leaf). The expression value was calculated by reads per kilobase per million reads (RPKM). The subgroup is marked on the left side of the gene list. The scale represents relative expression value.

