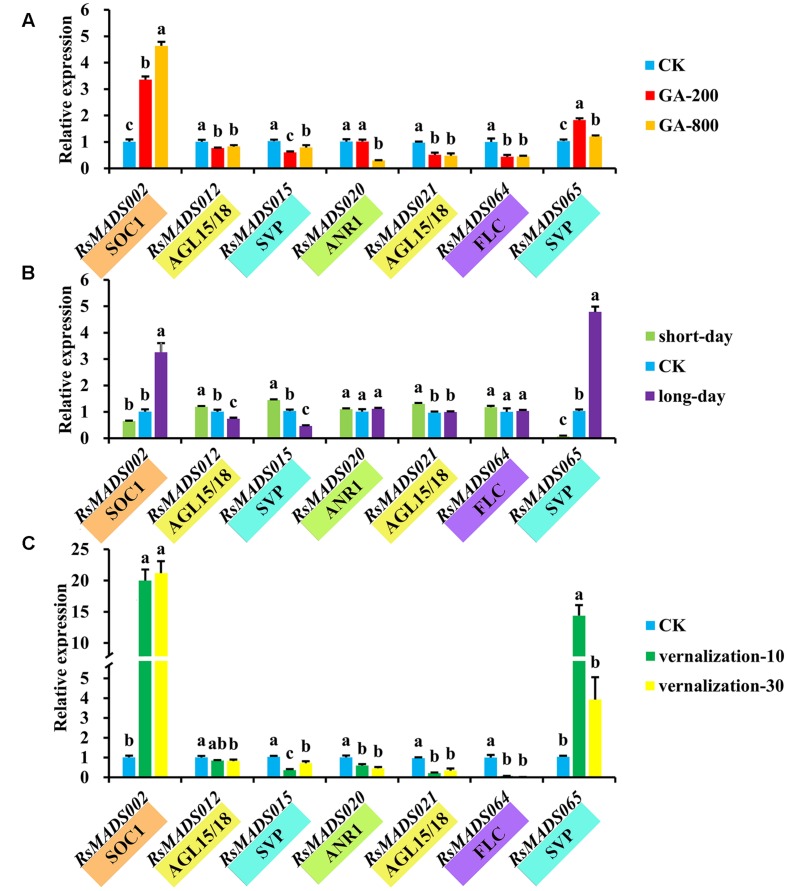
FIGURE 7.
The expression levels of representative RsMADS genes under GA (A), photoperiod (B) and vernalization (C) treatments. The subgroup is marked in different colors under the gene name. Each bar shows the mean ± SE of the triplicate assay. The value with different letter indicates significant difference at P < 0.05 according to Duncan’s multiple range tests.

