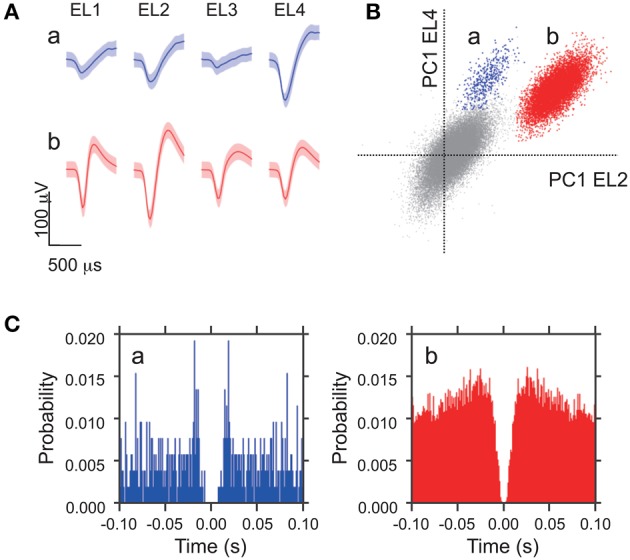
Figure 1.

Waveform characteristics of two representative amygdala neurons. (A) Waveforms (mean ± SD, shaded) simultaneously recorded from the four tetrode leads (EL 1–4). The waveforms indicated by a and b correspond to the two clusters in (B). (B) The results of an offline cluster analysis. Each dot represents one spike. The horizontal axis represents the first principle component (PC 1) of EL 2, and the vertical axis represents PC 1 of EL 4. (C) Autocorrelograms of neurons a and b. Autocorrelograms of neurons a and b show that refractory periods of the neurons were greater than 2 ms, consistent with these spikes originating from single neurons. Bin width = 1 ms.
