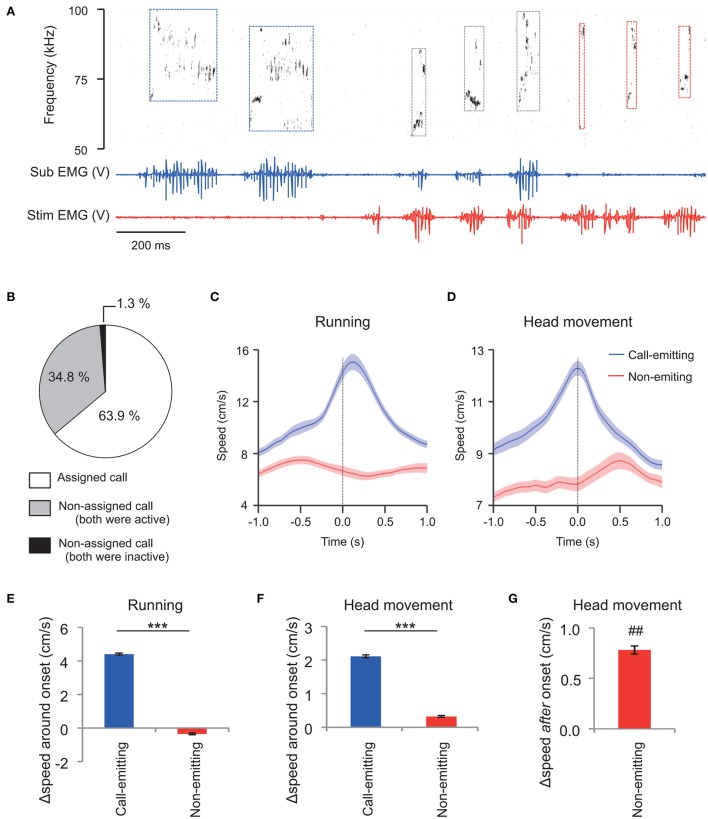
Figure 3.
Assignment of WFM calls during social interactions between vocalizing male rats (M sessions). (A) An example of call assignment. Simultaneously recorded sonogram (top), TA EMG of a subject rat (middle), and TA EMG of a stimulus conspecific (bottom) are shown. Each rectangle demarcated by dashed lines in the sonogram represents one call and the color of the square represents estimated source of the call (blue: the subject rat; red: the stimulus rat; black: indistinguishable) based on the concurrent TA EMG. Sub: subject; Stim: stimulus rat. (B) Distribution of call assignments. (C,D) Averaged (horizontal plane) speeds measured from the trunks (C) of and the head (translation) relative to the trunk (D). Speeds are shown for the call-emitting (blue) and non-emitting (red) rats. The solid lines and translucent areas indicate the means and SEMs, respectively. Time zero represents the onset of the calls. (E,F) The change in trunk speed in horizontal plane and head movement relative to the trunk around the onset of WFM calls [Δspeed around onset = (mean speed during the first 0.5 s after call onset) − (mean speed at −1.0 to −0.5 s prior to call onset)] of either the call-emitting (blue) or non-emitting (red) rats. (*** indicates p < 0.001, paired t-test). (G) The change in head movement relative to trunk after the onset of WFM calls [Δspeed after onset = (mean speed at 0.35–0.45 s after call onset) − (mean speed at −0.1–0.0 s prior to call onset)] of the non-emitting rats. (## signifies p < 0.01, one-sample t-test).

