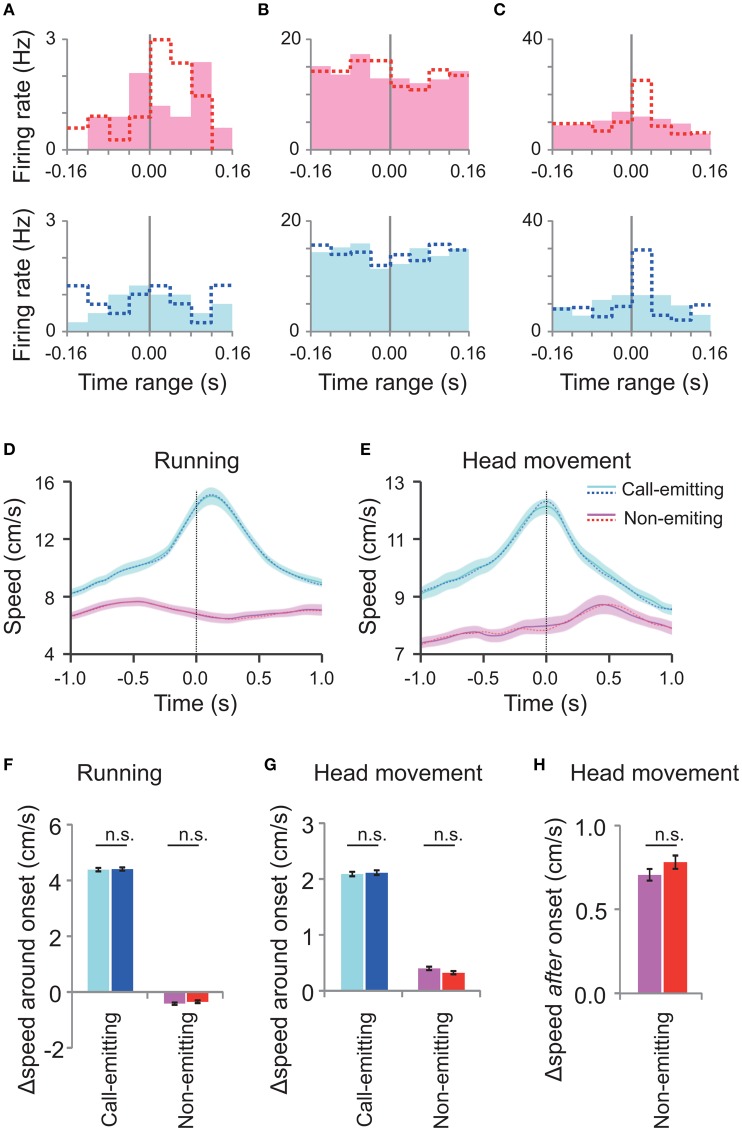
Figure 5.
Neuronal activity and rats' motion around the randomly shifted call onsets. (A–C) Peri-event histograms of spike activity around the randomly shifted call onsets (filled bars) of neurons shown in Figures 4A–C, respectively. Dotted lines indicate original responses. Responses to the call by the conspecific (pink) are displayed above and those of the subject (blue) below. (D,E) Average running (D) and head movement (E) speeds of interacting male subject and conspecific rats (30 rats; 27 M sessions) around the randomly shifted call onsets by the call-emitting (light blue) and non-emitting (pink) rats and the original data before the random shift (dotted line). The other descriptions are the same as those for Figures 3C,D. (F,G) The change in running speed and head movement around the randomly shifted onsets (left; light blue and pink) and original ones (right; blue and red) of either the call-emitting (light blue/blue) or non-emitting (pink/red) rats. Note that the speeds at the different onsets showed no significant difference (paired t-test, p > 0.05). Other descriptions are the same as those for Figures 3E,F. (H) Comparison of head movement after the random-shifted onsets (left) and original ones (right) of the non-emitting rats. The speed changes for the different onsets were not significantly different (paired t-test between the data before and after the random shift, p > 0.05). Other descriptions are the same as those for Figure 3G.

