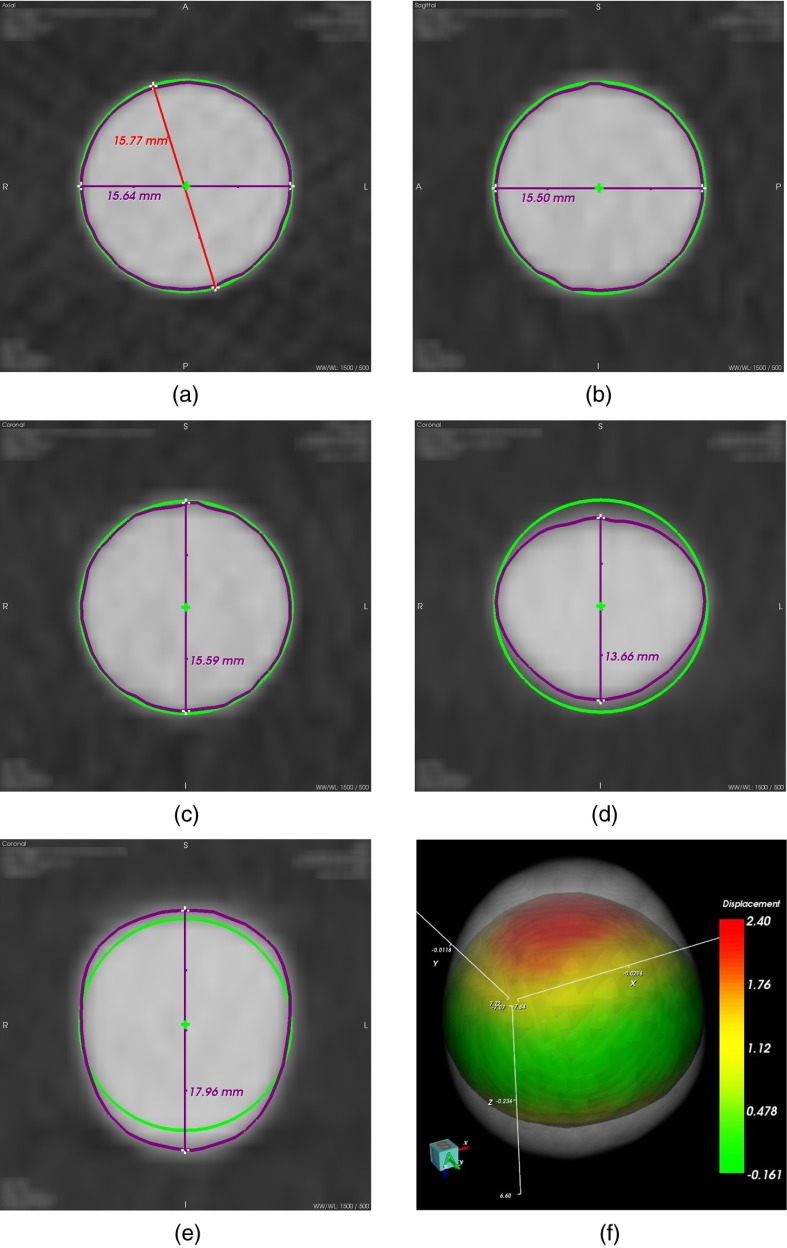
Fig. 1.
The top row shows (a) axial, (b) sagittal, and (c) coronal images of a Teflon sphere within a CT pocket phantom deployed in the ABIGAIL study. The bottom row demonstrates the amount of variation over two time points observed in the patient longitudinal dataset with the greatest volumetric change in size. (d, e) Coronal images show measurements of the Teflon sphere from the two time points with the largest observed change in volume. For images (a)–(e), estimated position of the ideal sphere boundary is shown in green, the constant threshold sphere boundary is shown in purple, and the RECIST measurement is shown in red. For image (f), the inner sphere shows the surface of the earlier and smaller volume time point (d), which has been color coded to illustrate the minimum radial distance displacement needed to reach the boundary of the next and larger volume time point (e). The outer gray object shows the extent of the outer surface of the Teflon sphere in the scan with the larger volume time point (e).

