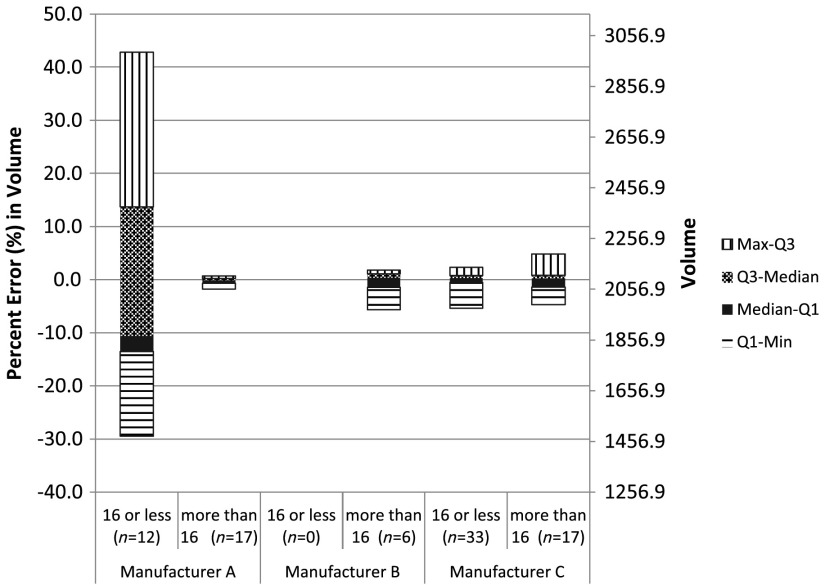
Fig. 3.
For the 43 patients with more than one scan, measurements made on CT scans at the subsequent visits were compared to their measurements at baseline and the percentage change in measurements was calculated. The entire range and quartiles of percentage change in volume measurements relative to the baseline value for these 43 patients (i.e., 85 subsequent visits) by the six combinations of manufacturers and detector row scanners. The largest measurement error for volume change was 43% from manufacturer A’s 16 or less detector row scanner.

