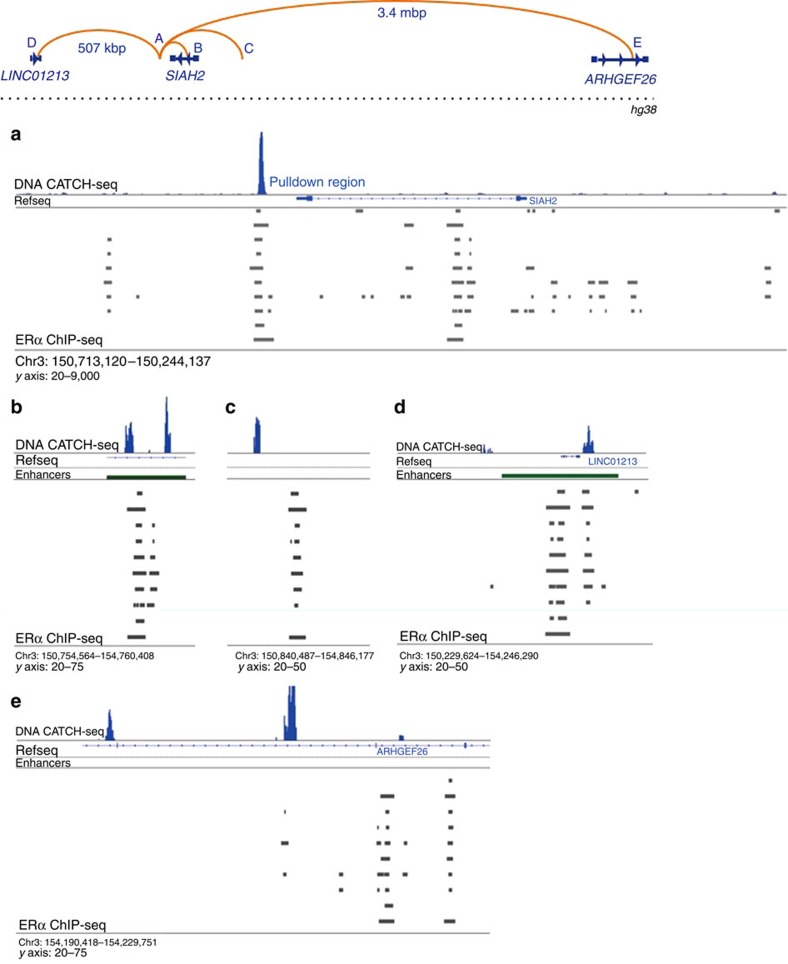
Figure 2. CATCH recapitulates chromatin interactions detected with ERα ChIA-PET.
Top diagram: the diagram represents the linear distances between (a) the downstream enhancer of SIAH2, (b) a SIAH2 intronic ERE and (c–e) three additional sites shown, using ChIA-PET, to have interaction with site A in MCF-7 cells. The y axis labels below integrative genomics viewer (IGV) histograms represent the number of sequencing reads after background subtraction. Subpanels: (a) the CATCH-seq pull-down region, also an enhancer downstream of SIAH2, is demonstrated to be highly enriched after CATCH-seq, confirming the efficacy of the capture method. (b) The SIAH2 intronic ERE, as denoted by the presence of ERα-binding sites detected by 10 different studies (grey bars, data sets outlined in the Methods section), was positive for two different interactions flanking the known ERα-binding regions. (c) The downstream ERE shows interaction with an ERα-binding region upstream of SIAH2; the location of the interaction was ∼2 kb from the ERα-binding site according to CATCH-seq. (d) An ERα-binding site near LINC01213 and (e) a region of ERα binding within ARHGEF26 both show interaction with the SIAH2 downstream ERE, as previously demonstrated by ref. 16.

