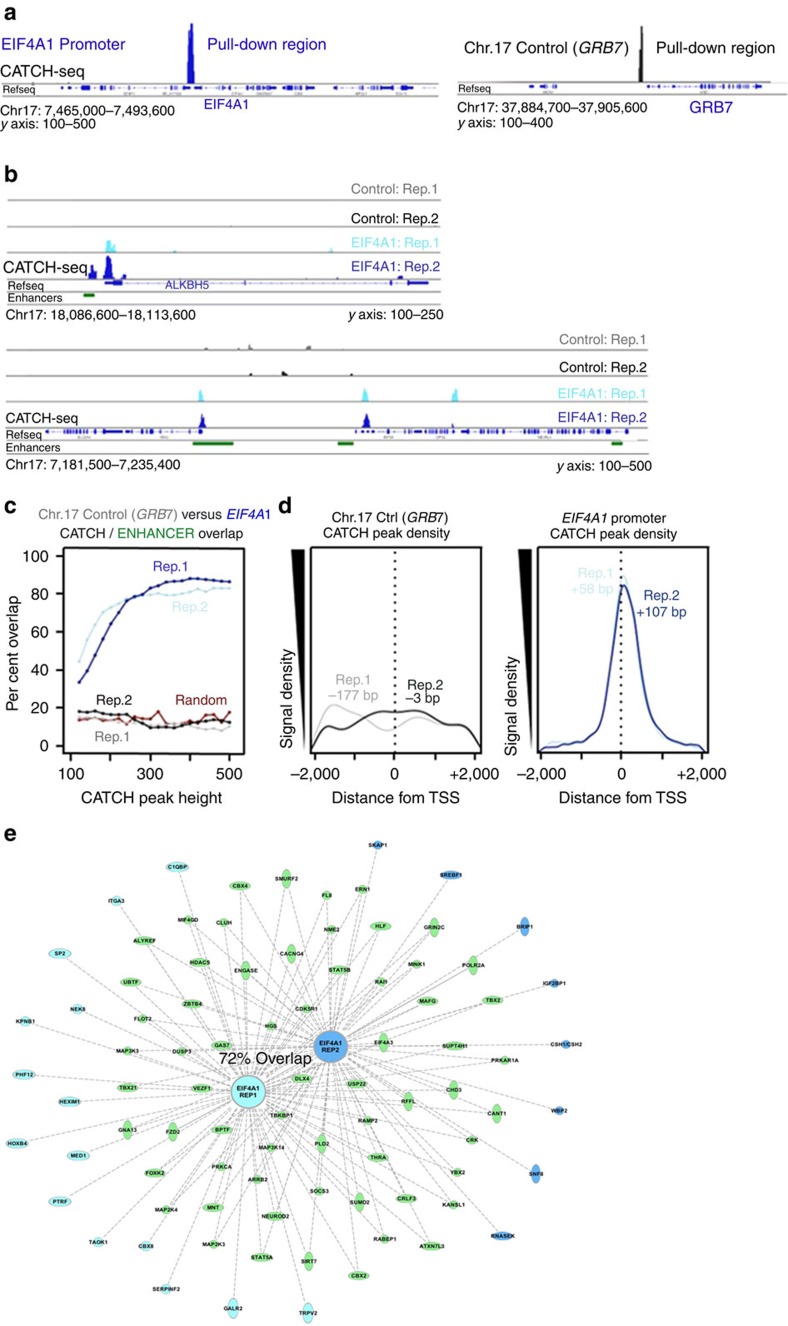
Figure 3. CATCH-seq demonstrates specificity and reproducibility.
y axis labels below IGV histograms represent number of sequencing reads after background subtraction. (a) The promoter region of EIF4A1 was directly captured via CATCH, along with the promoter region of GRB7, which served as a negative control for DNA–DNA interaction. (b) Examples of raw CATCH-seq histograms (background-subtracted) demonstrating the locations of peaks near gene promoters, and the reproducibility of multiple replicates. All histograms are on the same scale. (c) EIF4A1 promoter (blue) CATCH-seq interactions significantly overlap with enhancer marks (H3K4me1, H3K27ac) compared with control (greyscale), whose overlap is no greater than statistically random (red); the frequency of these overlaps increase with peak height. (d) The CATCH-seq interactions of the EIF4A1 promoter occur, on average, between 50 and 100 bp downstream of TSSs on chromosome 17. There was no discernable pattern near TSSs for the control pulldown. Both density plots have identical x and y axes. (e) Ingenuity pathway analysis (IPA) analysis detailing specific gene promoters that demonstrated physical interaction with the EIF4A1 promoter. There was a remarkable 72% overlap between the CATCH-seq replicates (shared interactions: green, unique interactions: light and dark blue).

