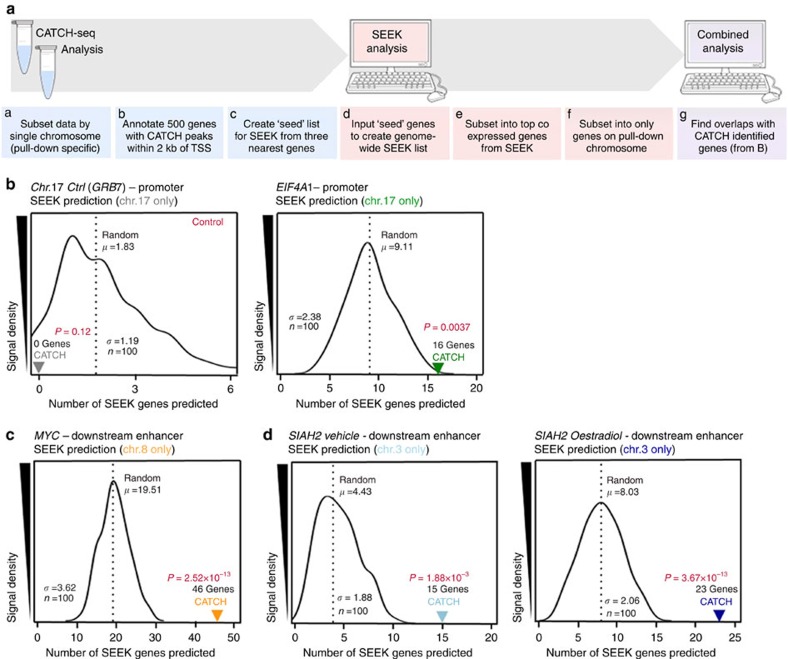
Figure 5. Finding CATCH-seq interactions at gene promoters predicts transcriptional coexpression.
(a) Graphic outlining the general processing and data analysis that assess the ability of CATCH interactions to predict SEEK coexpressed genes. (b) Histogram representing the number of SEEK genes ‘predicted' at random, or by specific CATCH-seq (left, grey: GRB7 negative control; right, green: EIF4A1 promoter). (c) Histogram representing the number of SEEK genes ‘predicted' at random, or by specific CATCH-seq (orange: MYC downstream enhancer). (d) Histogram representing the number of SEEK genes ‘predicted' at random, or by specific CATCH-seq (left, light blue: SIAH2–vehicle; right, dark blue: SIAH2–oestradiol). In each experimental case, CATCH was capable of significantly predicting SEEK coexpression over random. All analyses were restricted to the specific chromosome of the CATCH pulldown. P values were calculated via t-distribution.

