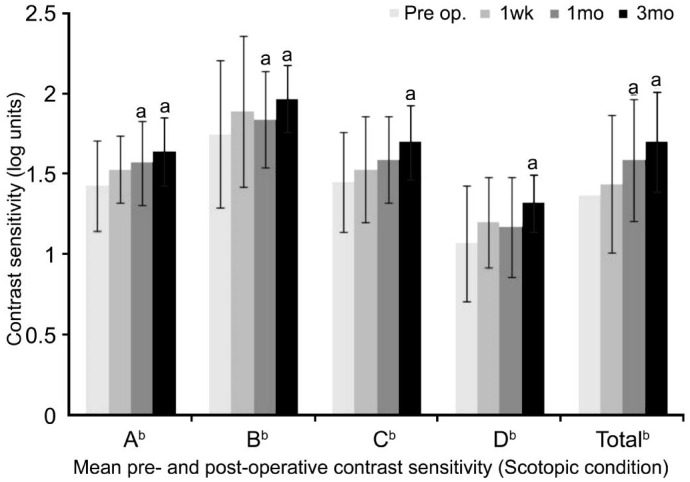
Figure 2. Mean pre- and postoperative contrast sensitivity (under photopic conditions).
Significant increases in contrast sensitivity were found at spatial frequencies A and B at 1 post-operative month and at each spatial frequency at 3 postoperative months (A: From 1.43±0.28 log units to 1.64±0.21 log units; B: From 1.75±0.46 log units to 1.97±0.21 log units; C: From 1.45±0.31 log units to 1.70±0.23 log units; D: From 1.07±0.36 log units to 1.32±0.18 log units; Total: From 1.37±0.40 log units to 1.70±0.31 log units). aThe correlation is significant at P<0.05 (paired t-test); bA: 3 cpd; B: 6 cpd; C: 12 cpd; D: 18 cpd; Total: Sum of A-D cpd contrast sensitivity values.

