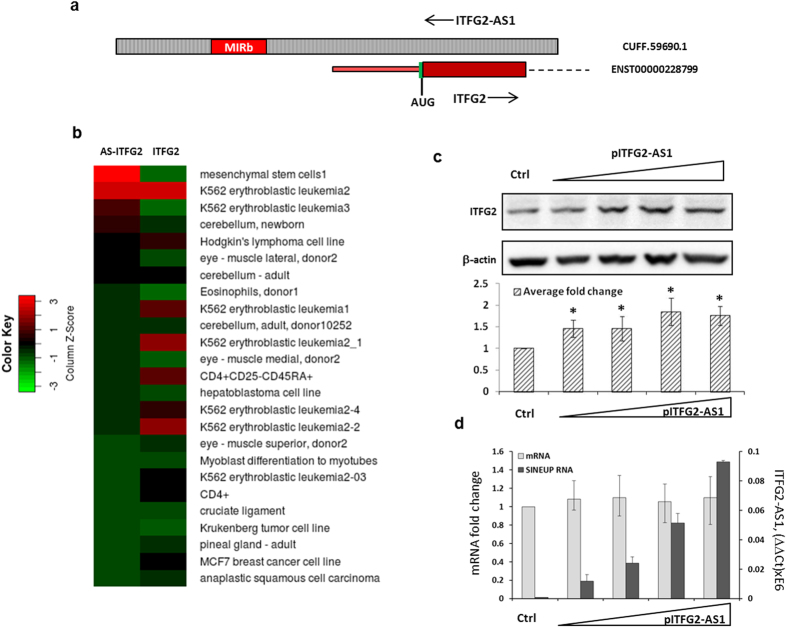
Figure 4. ITFG2-AS1 functions as a SINEUP in human cells.
(a) Genomic organization of the ITFG2/ITFG2-AS1 overlapping region (the elements are not in scale). The ITFG2 exons are shown in red, ITFG2-AS1 in dashed grey, and introns by dashed lines. Green vertical line indicates the position of the AUG codon in the mRNA. The position of the MIRb transposable element is indicated by a red box. (b) Expression of ITFG2 and ITFG2-AS1 in the FANTOM5 dataset. The tpm values for the top 25 samples of Supplementary Table 4 are presented as a matrix plot. (c) Western blot analysis of ITFG2 in HEK293T cells transfected with increasing amounts of the pITFG2-AS1 construct or empty vector as control, respectively. β−actin is shown as a control. (d) Quantification of ITFG2 mRNA and ITFG2-AS1 RNA levels in the HEK293T cell samples from panel c. *(n = 3, mean + S.D., p < 0.05, One-Sample t-Test, vs empty vector).

