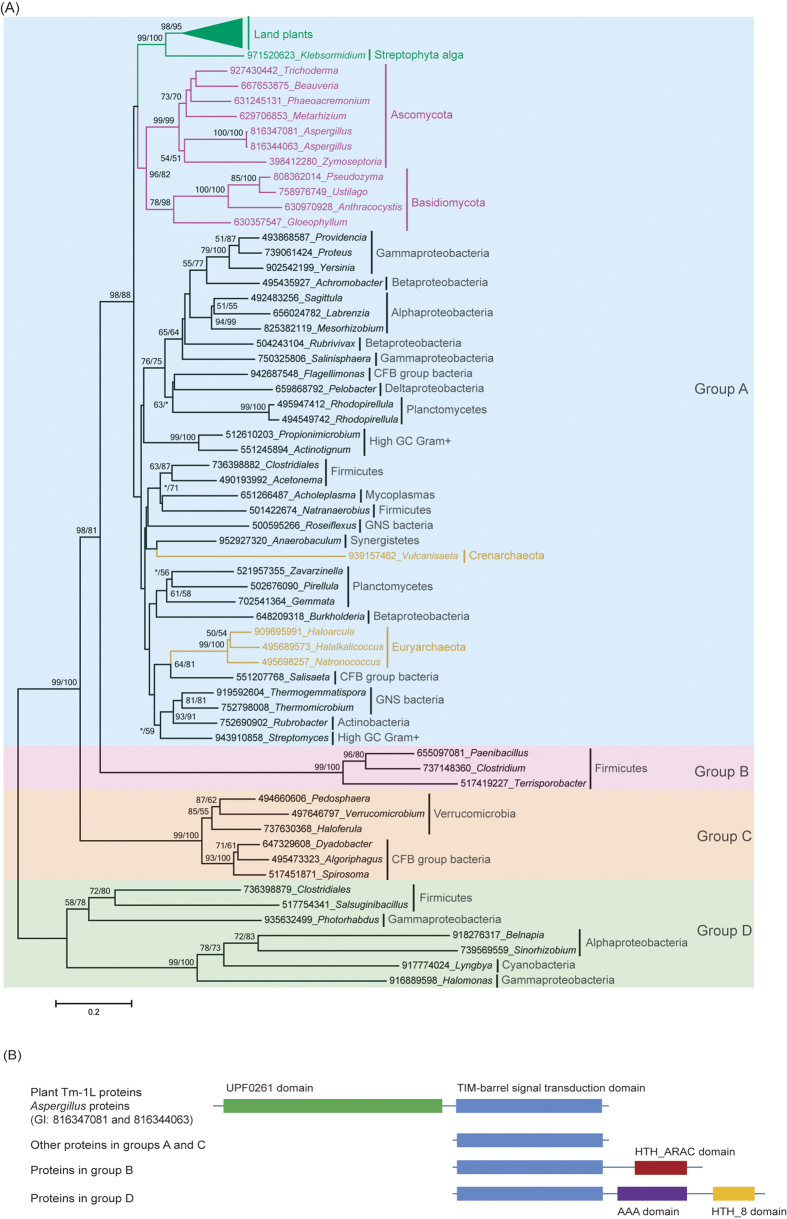
Figure 3. Phylogenetic analyses and the domain structures of the genes encoding TBST-domain-containing proteins.
(A) Phylogenetic analyses of the proteins containing a TBST domain. The numbers above the branches represent the bootstrap values for the maximum likelihood and distance analyses. All of the sequences were obtained from the NCBI, except for those in the green plants, and each protein is indicated by the GI numbers in NCBI and its genus. (B) The domain structure of the proteins that were used in the phylogeny.

