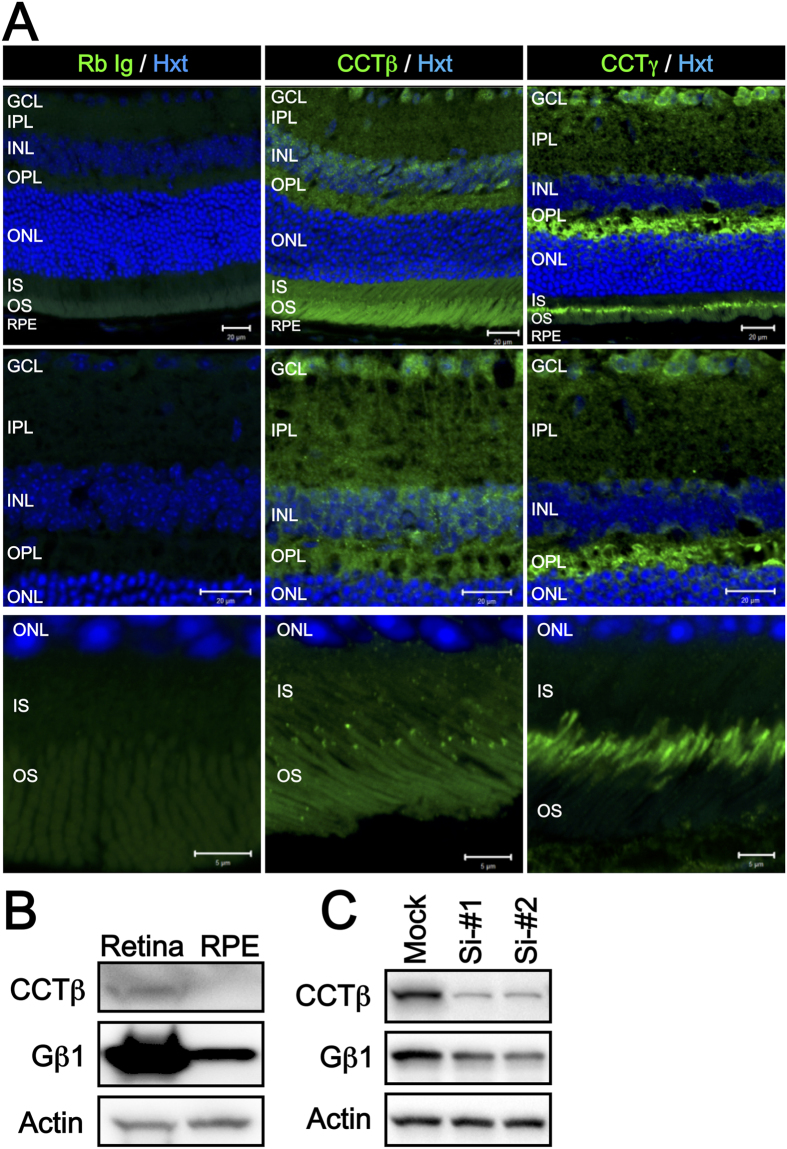
Figure 5. Localization of CCTβ and CCTγ in RGCs and Photoreceptor cells in Mouse Retina.
(A) Low magnification micrographs (top, scale bar = 20 μm) show the localization of CCTβ and CCTγ in ganglion cells and photoreceptor cells, respectively. Expression of CCTβ was more dominant in the cells of ganglion cell layer (middle micrographs, scale bar = 20 μm), while both CCTβ and CCTγ strongly localized between the IS and OS (bottom micrographs, scale bar = 5 μm). In the photoreceptor cells, CCTβ was diffusely distributed in the cytosol, and was also densely localized in punctate regions between the IS and OS, similar to the basal body dominant manner in which CCTγ localized to the basal body, thereby further connecting in a cilium manner in photoreceptor cells. (B) Expression levels of CCTβ and Gβ1 were higher in the retinal lysates than in the RPE lysates in the mouse eye. Detection of actin was used as a loading control. (C) CCTβ knockdown resulted in lower levels of Gβ1 expression after 4 days of siRNA treatment in 661W cells. GCL: ganglion cell layer; IPL: inner plexiform layer; INL: inner nuclear layer; OPL: outer plexiform layer; ONL: outer nuclear layer; IS: inner segment; OS: outer segment.

