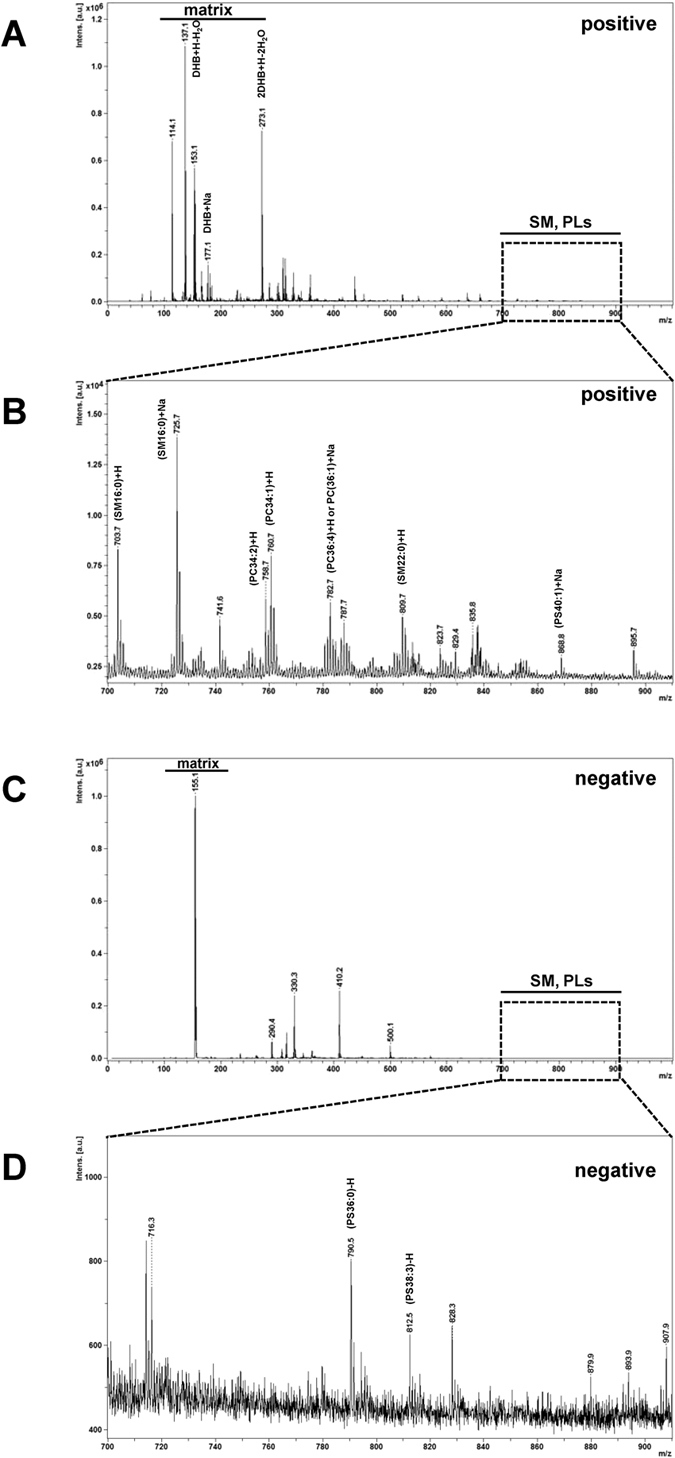
Figure 2. Example of MALDI-TOF MS spectra of lipid extracted from the pooled urine using protocol (i) (C:M_1:1).

(A,C) MS spectra were acquired by positive and negative ionization modes, respectively, in the m/z range of 0–1,000. DHB matrix ions were detected as three ion forms in the low-mass range. (B,D) Zoom-in MS spectra in the m/z range of 700–910, which covered the intact mass range of almost all of phospholipids (PLs) and sphingomyelin (SM), which is a class of sphingolipids (SPs).
