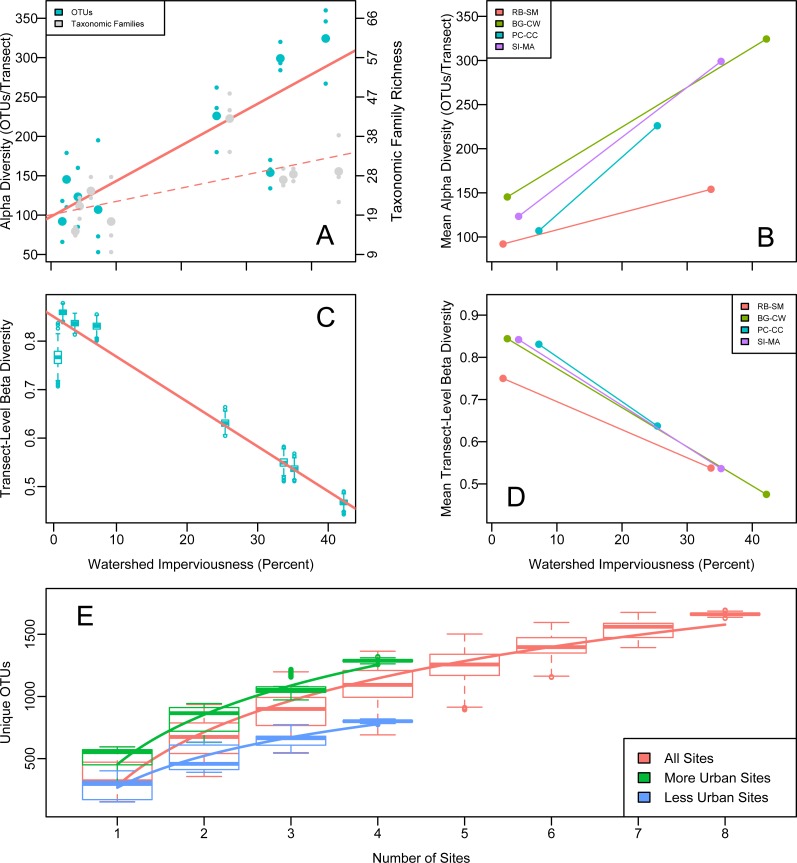
Figure 2. Alpha, beta, and gamma diversity recovered from water samples in Puget Sound along an urbanization gradient.
(A and B) Rarefied OTU richness and imperviousness—a proxy for urbanization—in Puget Sound. Analysis of a single focal rarefaction draw. (A) Rarefied 16s eDNA richness (solid trendline reflects OTUs; dashed trendline reflects taxonomic Families). Site means (larger circles) among transect-level data points (smaller circles). Family data shifted slightly for clarity. (B) The same data by site pair (N = 4 pairs of more- and less- urban sites), means plotted. Red lines indicate significant trends. Legends correspond to 2-letter site codes in Fig. 1. (C and D) (C) Mean among-transect (within-site) Whittaker’s beta diversity for each of 1,000 rarefaction draws from the overall OTU dataset, rarefied to create comparable sample sizes (N = 1.3 × 10⁵ OTUs per transect). Linear regression on site means, R2 = 0.95, p = 3.38 × 10⁻⁵. (D) Site means highlight the site-pair trends for single focal rarefaction draw. (E) Regional (gamma) diversity, in OTUs-per- site, as an accumulation curve. Boxplots show variance due to sampling each each set of sites (with replacement) 1,000 times from a pool of 1,000 rarefaction draws from the overall OTU dataset, rarefied to create comparable sample sizes (N = 1.3 × 10⁵ OTUs per transect). Best-fit logarithmic curves shown for more-urban sites (N = 4), less-urban sites (N = 4), and all sites (N = 8).

