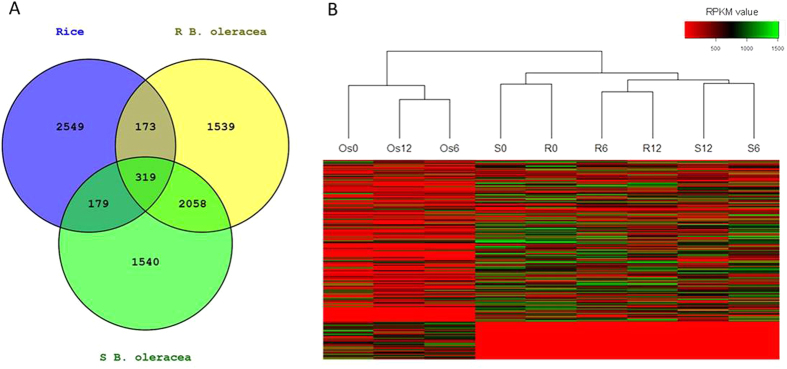
Figure 2. DEGs in rice and Brassica oleracea in response to Sclerotinia sclerotiorum.
(A) Venn diagram of DEGs in rice and B. oleracea during whole infection. (B) Heatmap of inoculated and non-inoculated B. oleracea and rice according to the RPKM values of DEGs. Os, rice; R, Resistant B. oleracea; S, susceptible B. oleracea; Os0, R0 and S0, non-inoculated controls; Os6, R6 and S6, samples collected 6 hpi; Os12, R12 and S12, samples collected 12 hpi.

