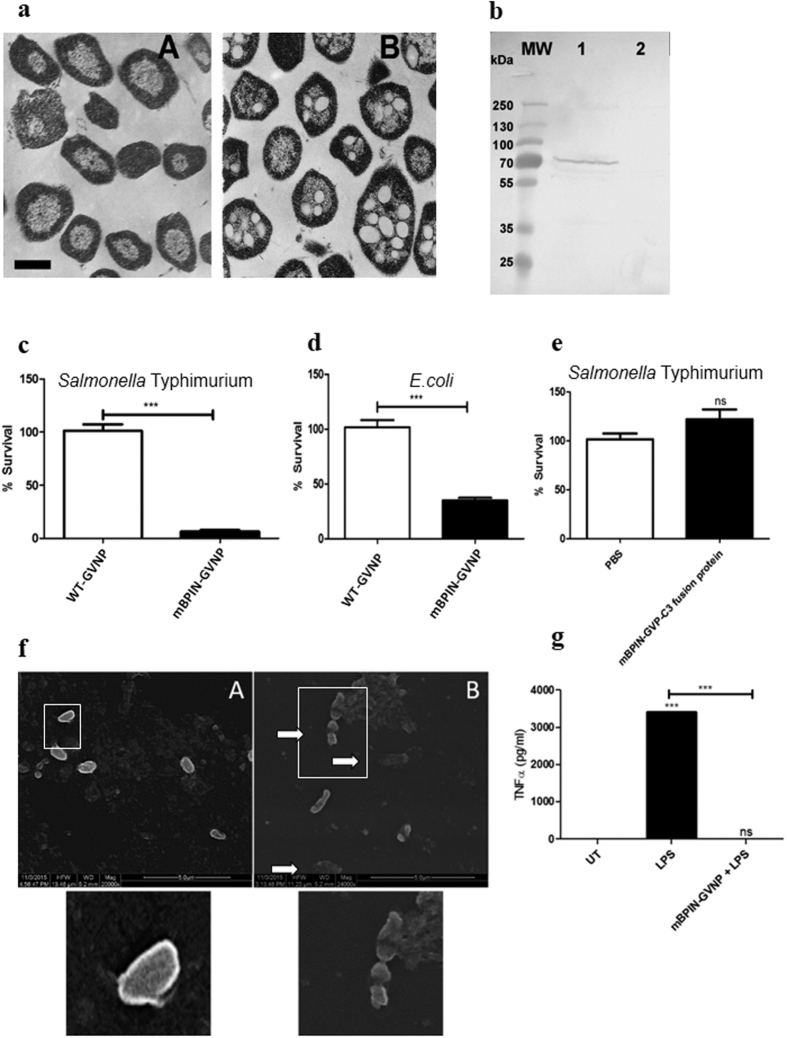
Figure 1. Expression of GvpC-mBPI N fusion protein in haloarchaeal gas vesicle nanoparticles and its antibacterial and anti-inflammatory activity.
(a) Thin-sections of Halobacterium sp. observed by transmission electron microscopy Panel A. Strain SD109 with a deletion of the gvp gene cluster and lacking GVNPs. Panel B. Strain SD109 transformed with a plasmid containing the entire gvp gene cluster producing buoyant GNPVs. Bar in Panel A indicates 0.5 um length (for both panels) (b) Halobacterium sp. NRC-1 (pDRK-C3-mBPI) BPI-GVNPs were produced and purified by floatation of the GVNP particles using the accelerated centrifugation and expression of GvpC-mBPINfusion protein was confirmed by Western blotting using a 1:1000 dilution of anti-His-tag primary antibody. Lane 1: mBPIN-GVNPs, Lane 2: WT-GVNPs. 106 Salmonella Typhimurium 14028 (c) and E. coli (d) were incubated with WT-GVNPs (White Bars) or mBPIN-GVNPs (Black Bars) for 2 hours at 37 °C. Cells were plated on LB agar and incubated at 37 °C overnight. Percent survival values are plotted and are means of triplicate assays. (n = 3 experiments) (e) 106 Salmonella Typhimurium 14028 were incubated with PBS (White Bars) or mBPIN-GVP-C3 fusion protein (Black Bars) for 2 hours at 37 °C. Cells were plated on LB agar and incubated at 37 °C overnight. Percent survival values are plotted and are means of triplicate assays. (n = 3 experiments) (f) 106 Salmonella Typhimurium 14028 were incubated with WT-GVNPs (Panel A) or mBPIN-GVNPs (Panel B) for 2 hours at 37 °C. Cells were fixed and observed by scanning electron microscopy. White arrow indicates membrane damage and leakage of cytosolic contents in bacteria incubated with mBPIN-GVNPs. Inserts were magnified to show cell morphology of WT-GVNP treated and mBPIN-GVNP treated bacteria. (g) PBMCs were treated with LPS (10 ng) or with LPS (10 ng) preincubated with mBPIN-GVNP. 24 h post treatment, supernatant was collected and TNFα levels were measured by ELISA. TNFαlevels were compared with un-treated control. (n = 3 experiments). Data was analyzed by students T test. Key: ***p < 0.001, **P < 0.01, *p < 0.05, ns = not significant.

