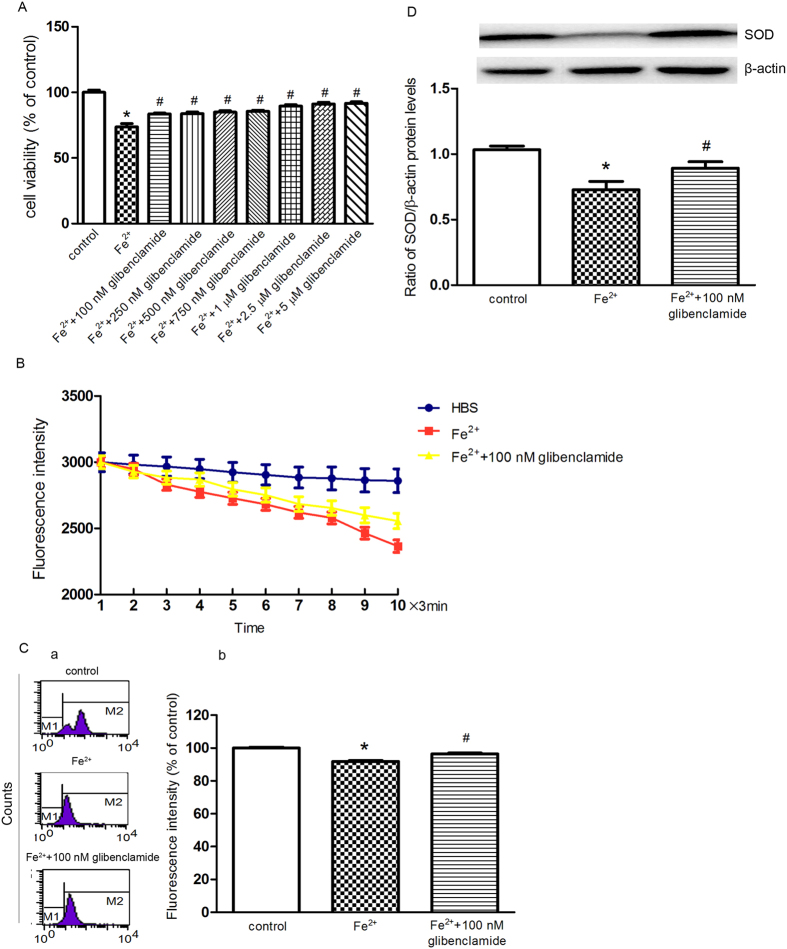
Figure 4. Inhibition of the KATP channels blocked ferrous iron influx and subsequent cell damage induced by Fe2+.
(A) The changes in cell viability was observed with glibenclamide pre-treatment. The cell viability with seven doses of glibenclamide pre-treatment prior to Fe2+ treatment was determined by MTT assay. The data was presented as the mean ± S.E.M. of six independent experiments. *P < 0.01, compared with control; #P < 0.01, compared with the Fe2+ group, n = 6. (B) The cells treated with 100 nM glibenclamide showed a more slow and steady fluorescence quenching, as compared with the Fe2+ group. The fluorescence intensities are represented as the mean value of 10 separate cells from four separate fields at each time point and are presented as the mean ± S.E.M. of 6 independent experiments. Two-way ANOVA, P < 0.05 for the Fe2+ group compared with control and the Fe2+/glibenclamide group compared with the Fe2+ group, n = 6. (C) Pre-treatment with 100 nM glibenclamide for 24 h partially reversed the decrease in ΔΨ m compared with the Fe2+ group. (a) Representatives of the fluorometric assay on ΔΨ m of different groups. (b) Statistical analysis. Data was presented as mean ± S.E.M. of 6 independent experiments. Fluorescence values of the control were set to 100%. *P < 0.01 compared with the control; #P < 0.01 compared with the Fe2+ group, n = 6 (D) Pre-treatment with 100 nM glibenclamide for 24 h partially prevented the down regulation of Cu/Zn–SOD, as compared with the Fe2+ group. β-actin was used as a loading control. Data was presented as the ratio of Cu/Zn–SOD to β-actin. Data was presented as the mean ± S.E.M of six independent experiments. *P < 0.01, compared with control; #P < 0.01, compared with the Fe2+ group, n = 6.

