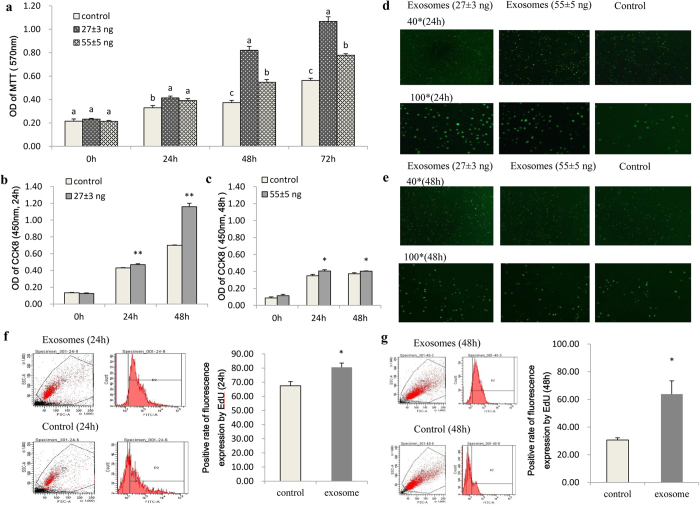
Figure 1. IPEC-J2 cell proliferation detected by different methods.
(a) Both 27 ± 3 ng and 55 ± 5 ng total RNA groups showed significantly improved OD values in the MTT assay, but the effect of the 27 ± 3 ng treatment group was more obvious (n = 10). (b,c) Effects of 27 ± 3 ng and 55 ± 5 ng total RNA treatment groups. The 27 ± 3 ng treatment group showed a significantly improved OD value (P < 0.01) in the CCK8 compared with the 55 ± 5 ng treatment group (n = 10). (d,e) Fluorescence intensity of IPEC-J2 cells after treatment with 27 ± 3 ng and 55 ± 5 ng total RNA for 24 h and 48 h. The 27 ± 3 ng treatment group showed greater fluorescence intensity by EdU fluorescence microscopy (n = 6). (f,g) Positive ratio of the 0.27 ± 0.03 μg total RNA (6-well plate) treatment group at 24 h and 48 h, respectively. The positive ratio significantly increased up to 80% after treatment for 24 h and 67% at 48 h by Edu flow cytometry (n = 6, 24 h).

