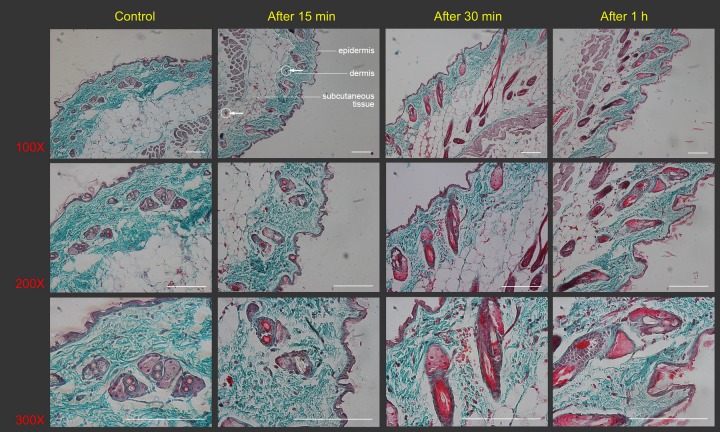
Figure 2. Histological images of mouse skin sections prior to and after Gua Sha treatment.
Representative images of Masson’s trichrome staining of mouse skin sections prior to and after 40 scrapes at different time points and magnifications were shown from three mice per group, scale bar = 100 µm. As an example, in the image (100×) taken 15 min after Gua Sha treatment, the boundaries between epidermis, dermis and subcutaneous tissue were depicted with white dots, and two groups of extravasated red blood cells were pointed out with white circles and arrowheads in dermis and subcutaneous tissue.

