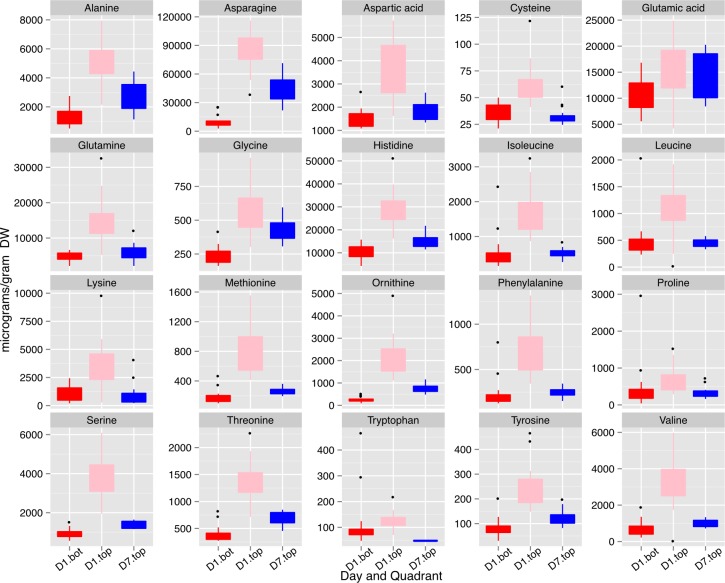
Figure 10. Concentrations of free amino acids in developing seeds.
Boxplots display the five number summary (median, 25, and 75% percentile define the box, with whiskers extending to 1.5 × interquartile range) for values from each sampling interval (3 replicates and 4 time points are merged within each box) and nodal position. Ornithine levels reflect both ornithine and arginine as arginine is converted to ornithine during sample prep for GC-MS. D1.bot, D1.top and D7.top refer to the samples collected on day one top and bottom quadrants and the day seven top quadrant respectively.

