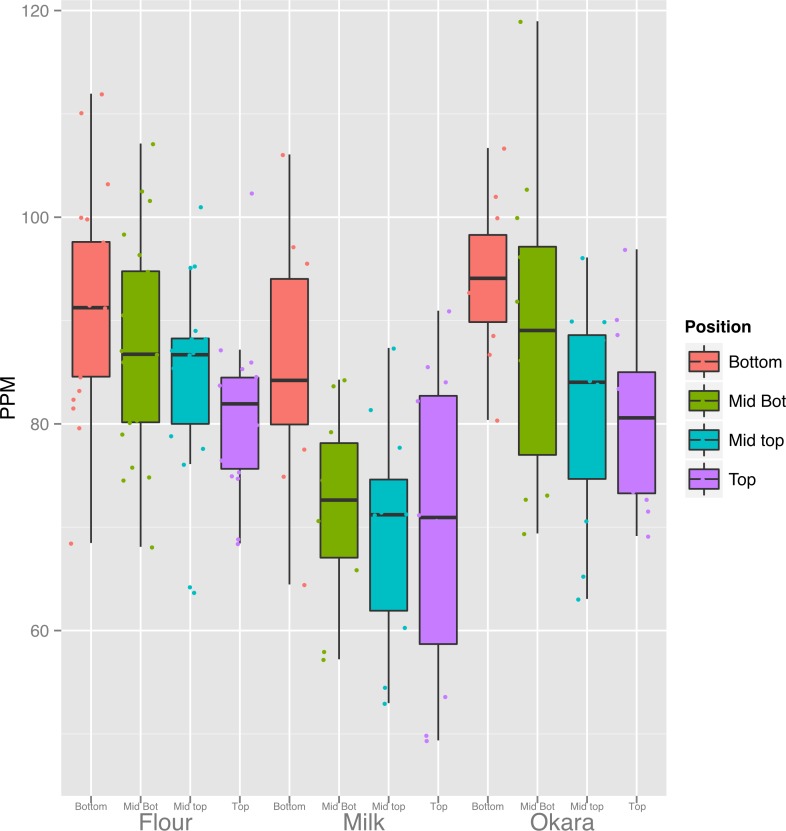
Figure 7. Canopy differences in iron are reflected in food products.
Fe content of the products from 3 replicates of seven lines (flour) and four lines (Milk and Okara). Boxplots display the five number summary (median, 25, and 75% percentile define the box, with whiskers extending to 1.5 × interquartile range).

